


Article Figures & Data
Figures
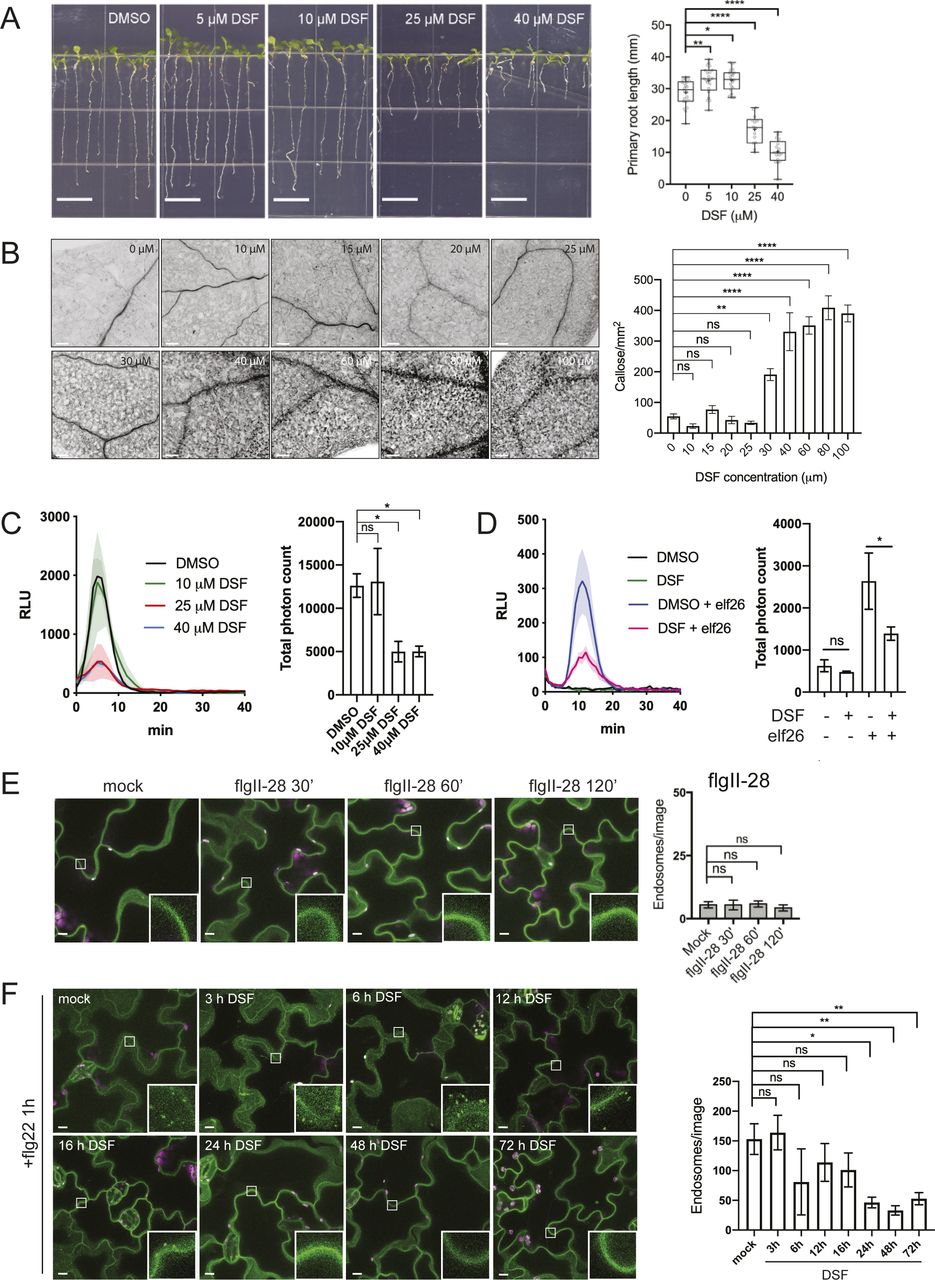
- Figure S1. Diffusible signal factor (DSF) affected plant growth and ligand-mediated responses.
(A) Growth of Arabidopsis Col-0 seedlings 7 d on 1/2 Murashige–Skoog agar supplemented with different concentrations of DSF (bar, 10 mm; n ≥ 14 plants). Growth assay was repeated twice with a similar result. (B) Callose deposition in Col-0 seedlings treated with increasing concentrations of DSF for 24 h (without any peptide elicitor) and visualized using aniline blue staining and confocal microscopy (n ≥ 18 images from three individual plants; bar, 100 μm). This experiment was performed once. (C) Reactive oxygen species assay of Col-0 leaves pretreated for 24 h with various DSF concentrations and elicited with flg22 peptide. The experiments were repeated twice. Total photon counts of different treatment were compared by one-way ANOVA (n ≥ 4). (D) Reactive oxygen species assay of Col-0 leaves pretreated with DMSO/25 μM DSF for 24 h and then elicited with 1 μM elf26 peptide. Total photon counts were compared by one-way ANOVA (n ≥ 4), and the experiment was repeated twice with a similar result. (E) Confocal micrographs of the FLS2 receptor signal on plasma membrane of FLS2–GFP seedlings after treatment with 10 μM flgII-28 (bar, 10 μm). Micrographs are maximum projections of 12 slices at every 1 μm z-distance. Bar graph on the right represents number of endosomes per image quantified from maximum-projected images (error bars, SEM, n ≥ 12 images from three seedlings). The experiment was performed twice. (F) Time-dependent inhibition of FLS2 endocytosis into endosomes by DSF. FLS2-GFP seedlings were treated with 25 μM DSF for indicated time followed by incubation with 10 μM flg22 for 60 min. Confocal micrographs represent maximum projections of 12 slices with 1-μm z-distance (bar, 10 μm; n ≥ 8 images from three individual seedlings). The experiment was performed once. P-values were determined by one-way ANOVA (*P < 0.05; **P < 0.01; ***P < 0.001; ****P < 0.0001; ns, not significant).
- Figure 1. Diffusible signal factor (DSF) simultaneously dampens several plant defense responses in Arabidopsis thaliana stimulated by the bacterial pathogen-associated molecular pattern flg22.
(A) Stomatal apertures of 5-wk-old Col-0 leaves after flg22 elicitation. Intact leaves were infiltrated with DMSO or 25 μM DSF diluted in 10 mM MgCl2 for 24 h before the epidermal layers of detached leaves were peeled off and treated with 1 μM flg22, stained with propidium iodine, and imaged. Stomatal apertures were measure by Fiji (n ≥ 130 stomata from n = 5 plants; bars, 10 μm). The experiment was repeated twice with a similar result. (B) Callose deposition in 2-wk-old Col-0 plants pretreated with DMSO or 25 μM DSF in 1/2 liquid MS for 24 h before being elicited by flg22 in liquid 1/2 MS. Leaves were stained with aniline blue and imaged using a confocal microscope with UV excitation to visualize flg22-triggered callose deposition. Plants treated with only DMSO or DSF were used as negative control (n ≥ 40 images from n = 8 plants; bar, 100 μm). The experiment was repeated twice. (C) Reactive oxygen species production and total photon count of reactive oxygen species burst in Col-0 leave strips pretreated with DMSO or 25 μM DSF for 24 h before flg22 elicitation (n ≥ 6 leaf discs/condition). The experiment was repeated three times. (D) Bacterial population at 4 d postinoculation in Arabidopsis 2-wk-old seedlings pretreated with DMSO (solvent control) or DSF, followed by priming with flg22 peptide and flooding assay with Pst DC3000. Boxplot represent pooled data from two independent experiments (n = 21). (E) Relative ratio of log10 (CFU/mg) was calculated by dividing the bacterial population of flg22-treated group and the control group for each of the treatment (DMSO or DSF). P-values were determined by one-way ANOVA (*P < 0.05; **P < 0.01; ***P < 0.001; ****P < 0.0001; ns, not significant).
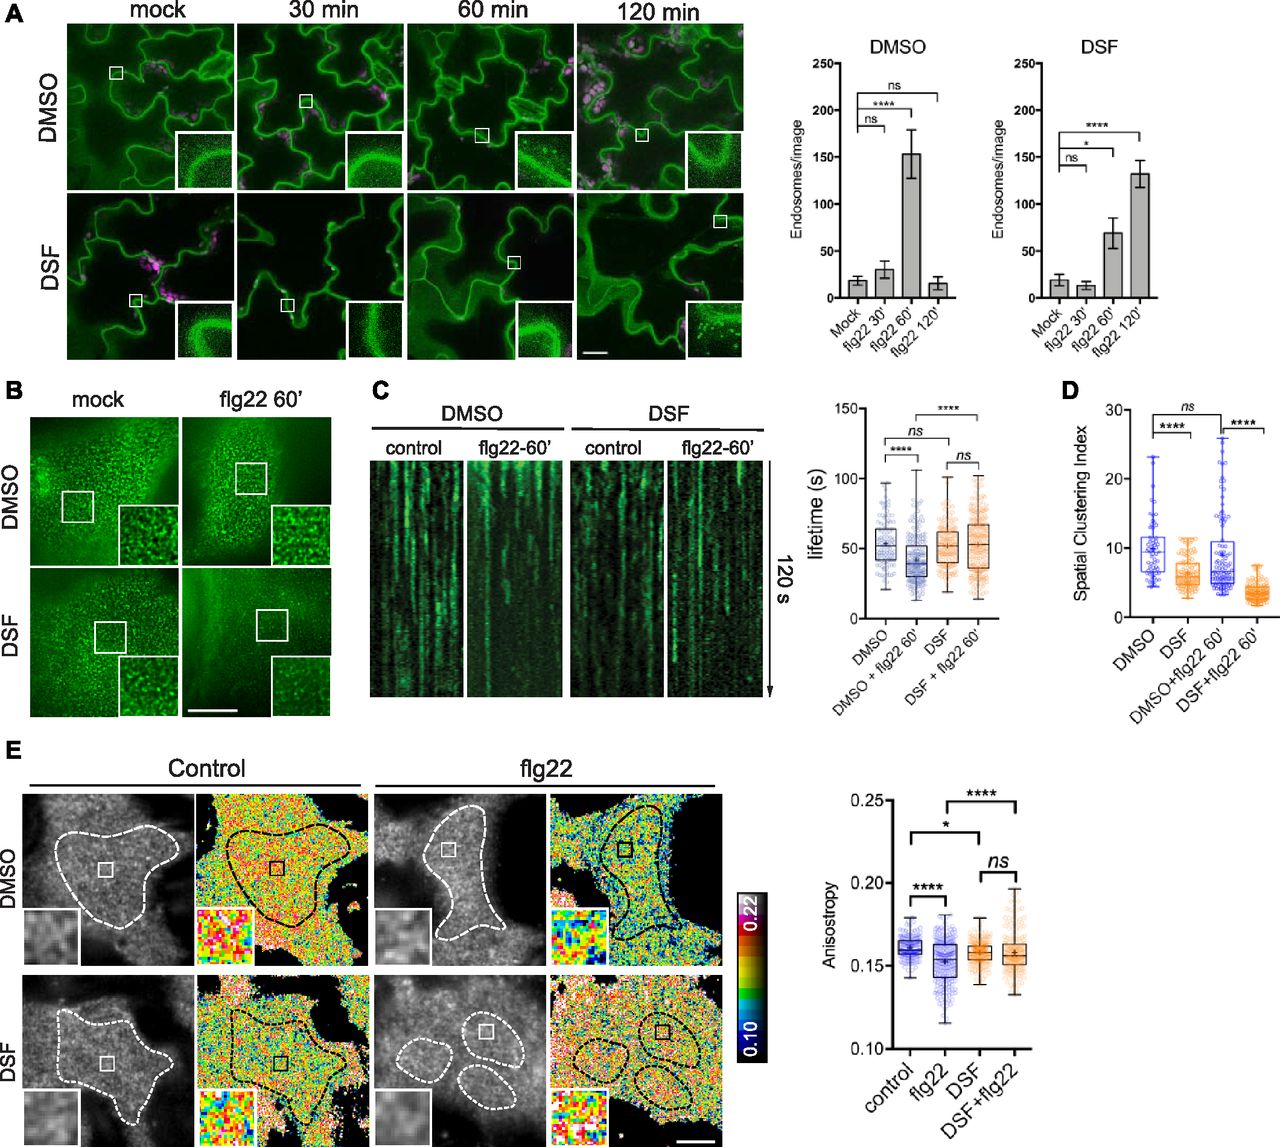
- Figure 2. Diffusible signal factor (DSF) delays ligand-induced endocytosis of the FLS2 receptor in response to flg22 peptide.
(A) 5-d-old FLS2–GFP seedlings were treated for 24 h in liquid 1/2 MS medium supplemented with 25 μM DSF or DMSO (solvent control) before being elicited with 10 μM flg22 and imaged at indicated time points. Micrographs represent maximum projections of 12 slices every 1 μm z-distance (bars, 20 μm). Bar graphs represent the numbers of endosomes per image. Error bars, SEM (n ≥ 12 from three plants). The experiment was repeated twice with a similar result. (B) FLS2–GFP receptors on the plasma membrane (PM) of Arabidopsis cotyledons. 5-d-old FLS2–GFP plants were treated with DMSO or DSF for 24 h before elicitation by 10 μM flg22 and imaged using VA-TIRFM (bar, 1 μm). (C) Kymographs of FLS2-GFP clusters on Arabidopsis PM before and after 60 min of flg22 elicitation, following DMSO or 25 μM DSF 24-h pretreatment. The lifetime of FLS2–GFP foci was measured from kymographs using Fiji (n ≥ 100 endocytic events from n ≥ 6 individual cells). (D) Boxplot represents spatial clustering of FLS2 receptor foci, indicated by the spatial clustering index. Spatial clustering index was calculated from TIRF time-lapse movies based on the ratio of top 5% of pixels with the highest intensity and 5% of pixels with the lowest intensity (n ≥ 60 ROIs from n ≥ 6). The experiment was performed twice. (E) Homo-FRET analysis of FLS2 receptor clustering on PM of DMSO- and DSF-treated FLS2–GFP seedlings upon flg22 elicitation for 5 min. As the PM is not definitely flat, anisotropy quantification was performed only in those well-focused regions of the PM (white dashed lines) (bar, 5 μm). Boxplot represents anisotropy values calculated from homo-FRET imaging of FLS2–GFP. Representative intensity and anisotropy images are shown. Insets are representative 20 × 20 pixel ROIs used for data analysis (n ≥ 150 ROIs from n ≥ 8 cells taken from three seedlings). The homo-FRET experiments were performed twice. P-values were determined by one-way ANOVA (*P < 0.05; **P < 0.01; ***P < 0.001; ****P < 0.0001; ns, not significant).
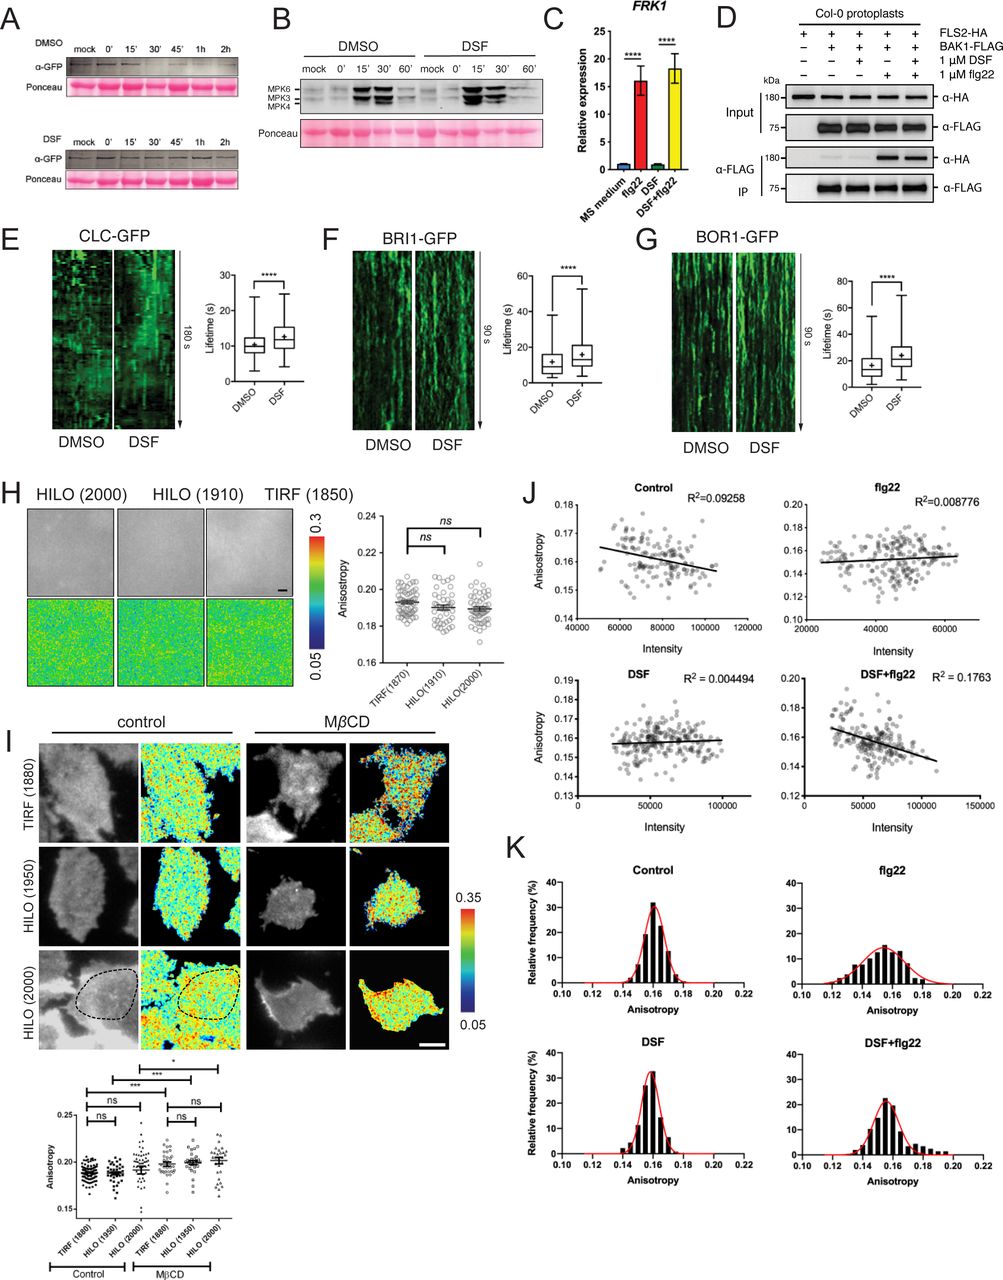
- Figure S2. Receptor endocytosis is affected by diffusible signal factor (DSF).
(A) Degradation of FLS2 receptor was delayed in DSF-treated plants. Leaf strips of 5-wk-old FLS2–GFP plants were floated for 24 h in water containing DMSO or 25 μM DSF, then elicited with 10 μM flg22 and snap-frozen in liquid nitrogen at indicated time points. Total protein extracts were probed with α-GFP antibody to detect FLS2. Staining of the membrane with Ponceau S served as loading control. The experiment was repeated three times with similar results. (B) Western blot analysis of MAPK responses of Col-0 leaf strips in response to the flg22 peptide at different time points, following 24-h treatment in 1/2 MS supplemented with DMSO or 25 μM DSF. Ponceau S staining of the Western blot membrane is shown as loading control. The experiment was repeated twice with a similar result. (C) Relative transcript abundance of FRK1 as measured by quantitative RT-PCR of FRK1 expression. Data represent relative expression to control calculated using the ΔΔCt method. Columns represent mean the relative gene expression level of at least six technical replicates from two biological replicates (error bars, SEM). (D) Co-immunoprecipitation assay on Arabidopsis protoplast co-transfected with FLS2–HA and BAK1–FLAG constructs. Transfected protoplasts were treated with 1 μM DSF for 12 h and elicited with 1 μM flg22 for 10 min and CoIP was performed with anti-FLAG antibody. The experiment was repeated twice with a similar result. (E, F, G) Kymographs and lifetime of clathrin light chain (CLC–GFP, n ≥ 250 events), brassinosteroid receptor BRI1 (BRI1–GFP, n ≥ 136 events), and boron receptor BOR1 (BOR1–GFP, n ≥ 198 events), from three individual seedlings. The experiment was repeated twice with a similar result. Kymographs were derived from VA-TIRF images obtained from corresponding marker lines grown on 1/2 MS plates for 5–6 d, then treated with DMSO (control) or 25 μM DSF for 24 h in 1/2 MS. (H) Anisotropy measured for purified GFP protein solution at definitive TIRF (incident angle was set as 1,880) and two HILO angles (1,910 and 2,000). Quantification data show similar anisotropy values that can be obtained in these three different incident angles (bar, 2 μm; n ≥ 42 ROIs). (I) Anisotropy measured at HILO–TIRF gave the same result as definitive TIRF, in which samples could be illuminated evenly. Anisotropy of control and MβCD (10 mM in glucose M1 buffer for 45 min at 37°C)-treated cells were measured at definitive TIRF (1,880) and HILO-TIRF (1,950 and 2,000) using stably transfected GFP–GPI construct in CHO cells. Measurements show the same results at definitive TIRF (1,880) and HILO-TIRF (1,950); and at HILO-TIRF (2,000), similar values can be obtained if measurements were considered from evenly illuminated area, which is highlighted by dotted line (bar, 5 μm, n ≥ 30 ROIs). (J) No correlation between Anisotropy values and signal intensity of FLS2–GFP from 20 × 20-pixel ROIs was observed as quantified by the homo-FRET experiment described in Fig 2E. (K) Distribution of FLS2–GFP anisotropy values from treatments described in Fig 2E. P-values were determined by one-way ANOVA (*P < 0.05; **P < 0.01; ***P < 0.001; ****P < 0.0001; ns, not significant).
- Figure 3. Diffusible signal factor (DSF) inhibited endocytosis in Arabidopsis roots by altering plant lipid profile.
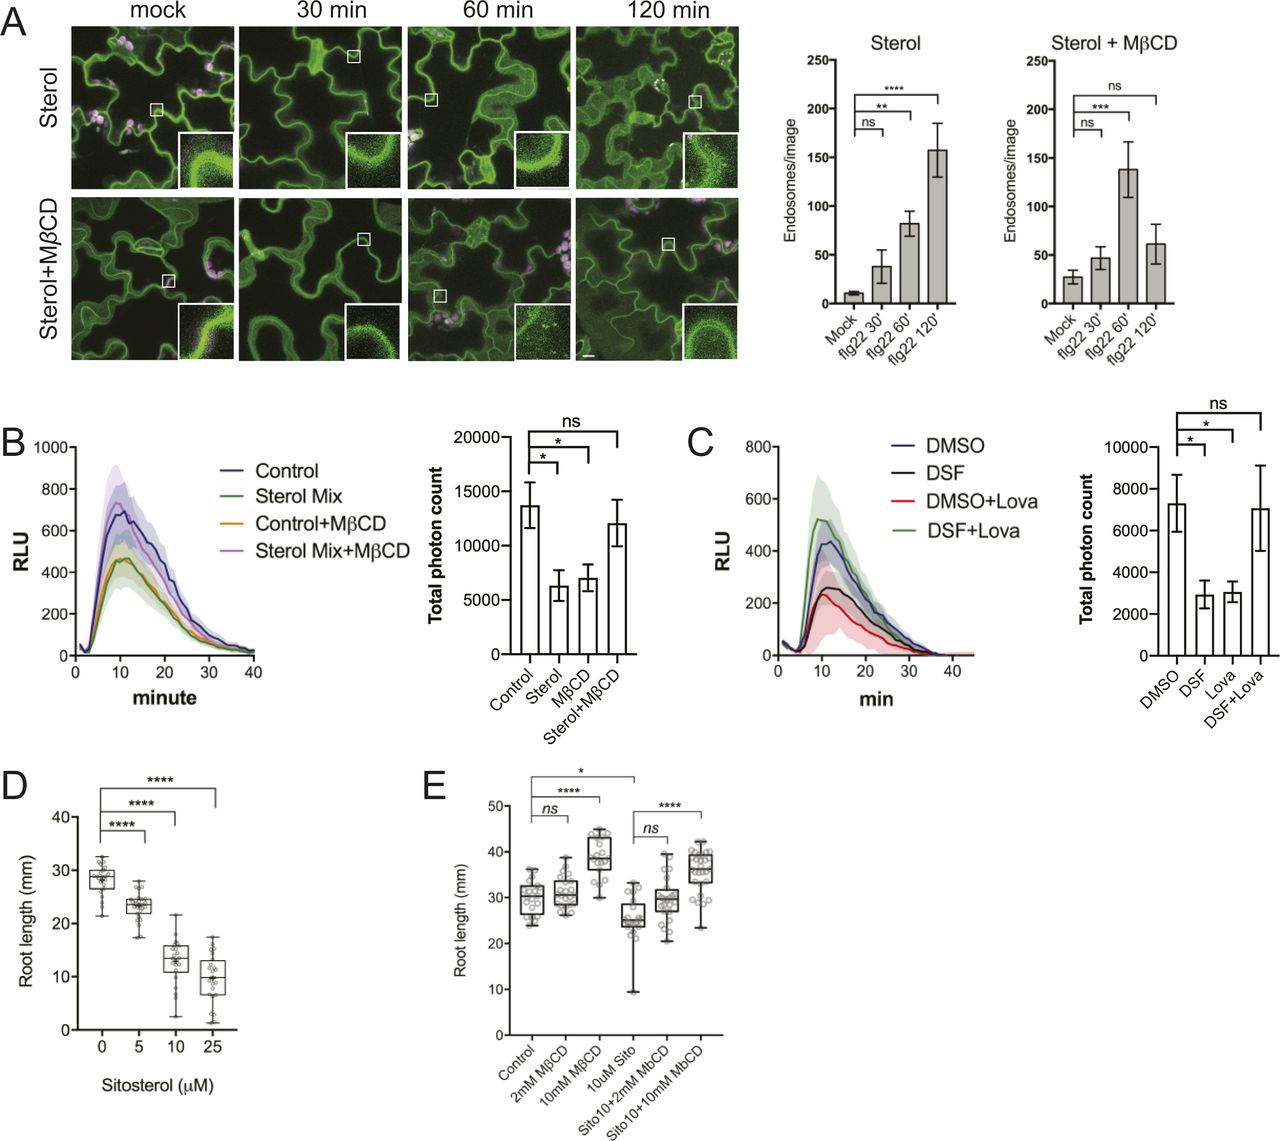
(A) Internalization of the endocytic tracer FM4-64 in PIN2–GFP seedling roots pretreated with DMSO or DSF for 24 h. Plants were treated in liquid 1/2 MS with DMSO (control) or 50 μM ES9-17 for 1 h before being stained with FM4-64 and visualized using confocal microscopy (n ≥ 5 plants; bars, 10 μm). (B) Accumulation of intracellular FM4-64 signals into BFA compartments after BFA treatment. PIN2–GFP seedlings pretreated for 24 h on 1/2 MS agar supplemented with DMSO or DSF were subjected to BFA or ES9-17+BFA treatments before being stained with FM4-64 and imaged (n ≥ 5 plants; bars, 10 μm). (C) Boxplot represents the ratio of intracellular/plasma membrane signal intensity of FM4-64 dye in root cells presented in Fig 3A as an indicator of bulk endocytosis (n ≥ 37 cells from n ≥ 5 plants). (D) Boxplot represents the area of BFA compartments in seedlings grown on DMSO- or DSF-supplemented plates as presented in Fig 3B, n ≥ 161 BFA compartments from n ≥ 5 plants. The FM4-64 uptake experiments were repeated twice with a similar result. (E) Growth of Col-0 seedlings on 1/2 MS agar supplemented with DMSO, 25 μM DSF, 2 mM MβCD, and 25 μM DSF+2 mM MβCD. Images of whole seedlings and root hairs were taken after 7 d (top panel bars, 10 mm; bottom panel bar, 1 mm). The length of primary roots (n ≥ 20 seedlings) and root hairs (n ≥ 140) of 7-d-old seedlings on different media measured by Fiji. The experiment was repeated at least three times with a similar result. (F) Lipidomic profiles of Arabidopsis Col-0 seedlings after 7 d growing on 1/2 MS agar supplemented with either 25 μM DSF, 2 mM MβCD, or 25 μM DSF + 2 mM MβCD. Heat map representing the log2 value of fold change compared with DMSO treatment (n = 6 biological replicates). The bar graph parallel to the heat map indicates the relative abundance (in percentages) of the corresponding species within each lipid class. (G) DSF-induced inhibition rate of sterol mutants fk-X224 and smt1-1 and their corresponding wild-type ecotypes Ler and Ws. Seedlings were monitored for 7 d on DMSO- and 25 μM DSF-supplemented 1/2 MS plates (n ≥ 28 plants). Inhibition rate (%) was represented by the ratio between the difference in primary root length of seedlings on control (DMSO) versus DSF-supplemented medium and the mean primary root length of control seedlings. Growth assay with sterol mutant was repeated twice with a similar result. P-values were determined by one-way ANOVA (*P < 0.05; **P < 0.01; ***P < 0.001; ****P < 0.0001; ns, not significant).
- Figure S3. Diffusible signal factor (DSF) did not cause morphological changes in Arabidopsis endosomal compartments.
(A, B, C) Confocal micrographs of DMSO/DSF–pretreated Arabidopsis early endosome marker line (VHAa1–GFP), late endosome marker line (RabF2b–FP), and Golgi marker line (Got1p–YFP) stained with FM4-64 dye with or without BFA treatment (bar, 10 μm; n ≥ 3 plants). The relative size of enlarged multivesicular bodies (MVB) and BFA compartments were measured by Fiji. (D) Ultrastructural observation of Arabidopsis organelles in 8-d-old seedlings pretreated with DMSO/DSF observed by transmission electron microscopy (upper panel scale bar, 200 nm; lower panel scale bar, 500 nm). Annotations on the electron-micrographs are as follows: G, Golgi; TGN, trans-Golgi network; CW, cell wall; m, mitochondria; MVB, multi-vesicular body; and C, chloroplast. (E) Sterol biosynthetic pathways in Arabidopsis thaliana. Corresponding mutants were labeled in each step of the pathways, with dashed arrows indicating multiple biosynthetic steps. (F) Growth of sterol biosynthesis mutants fk-X224 and smt1-1 and their corresponding wild-type ecotypes (Ler and Ws, respectively) on 1/2 MS agar supplemented with DMSO or 25 μM DSF. Plates were scanned after 7 d after sowing the seeds (n ≥ 26 individual seedlings; bar, 5 mm). The experiment was repeated twice with similar result. P-values were determined by two-tailed t test (*P < 0.05; **P < 0.01; ***P < 0.001; ****P < 0.0001; ns, not significant).
- Figure 4. Sterol depletion by MβCD recovered diffusible signal factor (DSF)/sterol-induced phenotypes on Arabidopsis seedlings.
(A) FLS2 receptor internalization into endosomes monitored by confocal microscopy following 10 μM flg22 treatment. FLS2–GFP seedlings were pretreated for 24 h with DMSO or 25 μM DSF in 1/2 MS, followed by a brief 2 mM MβCD treatment for 30 min before peptide elicitation. Micrographs represent maximum projections from 12 slices taken every 1-μm z-distance. Bar graphs showed the number of endosomes per image (n ≥ 10 images from three individual seedlings; bar, 20 μm). The experiment was repeated twice with a similar result. (B) Internalization of FM4-64 dye of PIN2–GFP seedling roots after plants were treated for 24 h on 1/2 MS plates with 25 μM DSF followed by 30-min treatment with 2 mM MβCD in liquid 1/2 MS. Plants were treated with 50 μM ES9-17 for 1 h and/or 50 μM BFA for 1 h before staining with FM4-64, and DMSO was used as solvent control (n ≥ 5 plants; bar, 10 μm). Quantification of intracellular/plasma membrane ratio was performed on n ≥ 50 cells from n ≥ 5 plants, and BFA bodies area measurement was performed on n ≥ 250 BFA bodies from n ≥ 5 plants. The experiment was repeated twice with a similar result. The ratio of intracellular/plasma membrane in treatment with ES9-17 versus without ES9-17 treatments of the DSF+MβCD–treated plants was compared with that of the DSF-treated plants presented in Fig 3C. (C) Reactive oxygen species production and total photon count of reactive oxygen species burst from Col-0 leaf strips treated for 24 h with DMSO or 25 μM DSF, followed by a 30-min treatment with water (control) or 2 mM MβCD before elicitation by 1 μM flg22 peptide (n ≥ 5/treatment). The experiments were repeated twice with a similar result. P-values were determined by two-tailed t test (*P < 0.05; **P < 0.01; ***P < 0.001; ****P < 0.0001; ns, not significant).
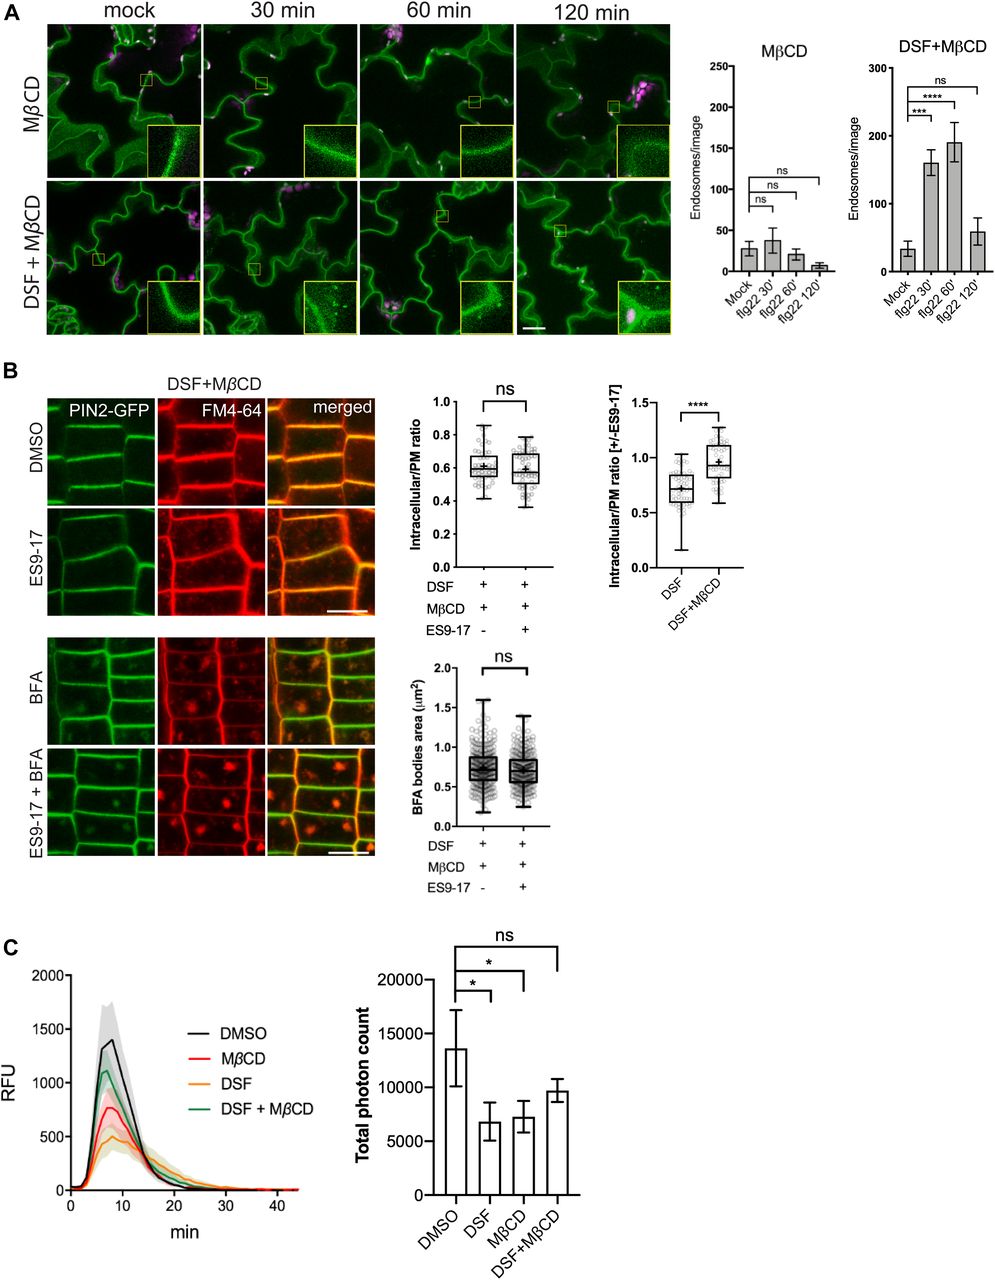
- Figure S4. Sterol removal by MβCD restored phytosterol-induced inhibition of endocytosis.
(A) flg22-induced endocytosis of FLS2–GFP into endosomes as control experiments for Fig 4A. Maximum projections of z-stacks images are shown. FLS2–GFP seedlings were pretreated for 24 h in 1/2 MS supplemented with DMSO (control) or 25 μM diffusible signal factor (DSF) (n ≥ 10 images from three individual seedlings; bar, 10 μm). The experiment was repeated twice. (B) FM4-64 dye uptake by PIN2–GFP roots treated with MβCD in combination with ES9-17/BFA (n ≥ 5; bars, 10 μm). (C) Life time of clathrin light chain (CLC)–GFP in the presence of DSF, MβCD, and a combination of both drugs. CLC–GFP seedlings were treated with DMSO/25 μM DSF for 24 h in 1/2 MS medium, and then subjected to a brief treatment of 2 mM MβCD before being imaged using VA-TIRF (n ≥ 471 events from three individual seedlings). (D, E) Sterol mix similarly inhibits FM4-64 uptake in combination with the clathrin inhibitor ES9-17. (D, E) 5-d-old PIN2-GFP seedlings were transferred to 1/2 MS plates containing 50 μM sterol mix (D) or 50 μM sterol mix + 10 mM MβCD (E) for an additional day. Plants were subjected to drug treatments (50 μM ES9-17, 1 h; 50 μM BFA, 1 h; or a combination of both drugs) before being stained with FM4-64 and imaged (n ≥ 5, bars, 10 μm). The experiment was performed twice with a similar result. P-values were determined by one-way ANOVA (*P < 0.05; **P < 0.01; ***P < 0.001; ****P < 0.0001; ns, not significant).
- Figure S5. Phytosterols mimic diffusible signal factor–induced inhibition of receptor internalization, reactive oxygen species (ROS) production, and primary root growth.
(A) Internalization of the FLS2 receptor was monitored in FLS2–GFP seedling cotyledons. Plants were pretreated with 50 μM sterol mix or sterol mix + 2 mM MβCD for 24 h before elicitation with 10 μM of flg22 and imaged at indicated time points (n ≥ 12 images from three individual plants; bars, 10 μm). Boxplots represent the number of endosomes per image as quantified by segmentation and particle analysis using Fiji. The experiment was repeated twice. (B) ROS burst in response to flg22 in Col-0 leaf strips pretreated for 24 h with solvent control or 50 μM sterol mix, with or without 2 mM MβCD. (C) ROS production by Col-0 leaf strips pretreated with DMSO/25 μM diffusible signal factor for 24 h simultaneously with the sterol biosynthesis inhibitor Lovastatin (Lova, 1 μM). Leaf strips were then elicited with 1 μM flg22 and luminescence was monitored every minute for 1 h by a BioTek Cytation 5 plate reader. The experiment was repeated twice with a similar result. (D) Root growth of Col-0 plants on 1/2 MS plates supplemented with different concentrations of β-sitosterol 7 d after sowing (n ≥ 22). (E) Dose-dependent reversion of β-sitosterol–induced growth inhibition of Arabidopsis Col-0 by MβCD. Col-0 seeds were germinated on 1/2 MS agar supplemented with β-sitosterol in combination with 2 or 10 mM of MβCD. After 7 d, the plates were scanned and primary root lengths were measured using Fiji. Boxplot represents data from n ≥ 20 seedlings. Growth experiments were repeated twice. P-values were determined by one-way ANOVA (*P < 0.05; **P < 0.01; ***P < 0.001; ****P < 0.0001; ns, not significant).
- Figure 5. Lipid nanodomain integrity is dependent on proper sterol composition of the plasma membrane.
(A) 2D-Structured Illumination Microscopy images of the nanodomain marker REM1.2-GFP taken after 24-h treatment with DMSO, diffusible signal factor (DSF), or sterol mix followed by a 30-min treatment with 2 mM MβCD or water control (bar, 2 μm). (B) Quantification of Remorin foci intensity on plasma membrane (n = 500 foci from ≥10 cells were analyzed). (C) Self-clustering state of FLS2–GFP receptors before and after 5 min of elicitation with 10 μM flg22 following treatment of the seedlings MβCD or DSF+ MβCD. Representative intensity and anisotropy images are shown. Insets are representative 20 × 20-pixel ROIs used for data analysis (bar, 5 μm). (D) Boxplot represents anisotropy values measured from Homo-FRET experiment (n ≥ 150 ROIs from eight images acquired from n ≥ 3 seedlings). Anisotropy ratio (flg22/mock) was calculated by dividing the anisotropy value in flg22 treatment to that of water control. The experiment was repeated twice. P-values were determined by one-way ANOVA (*P < 0.05; **P < 0.01; ***P < 0.001; ****P < 0.0001; ns, not significant).
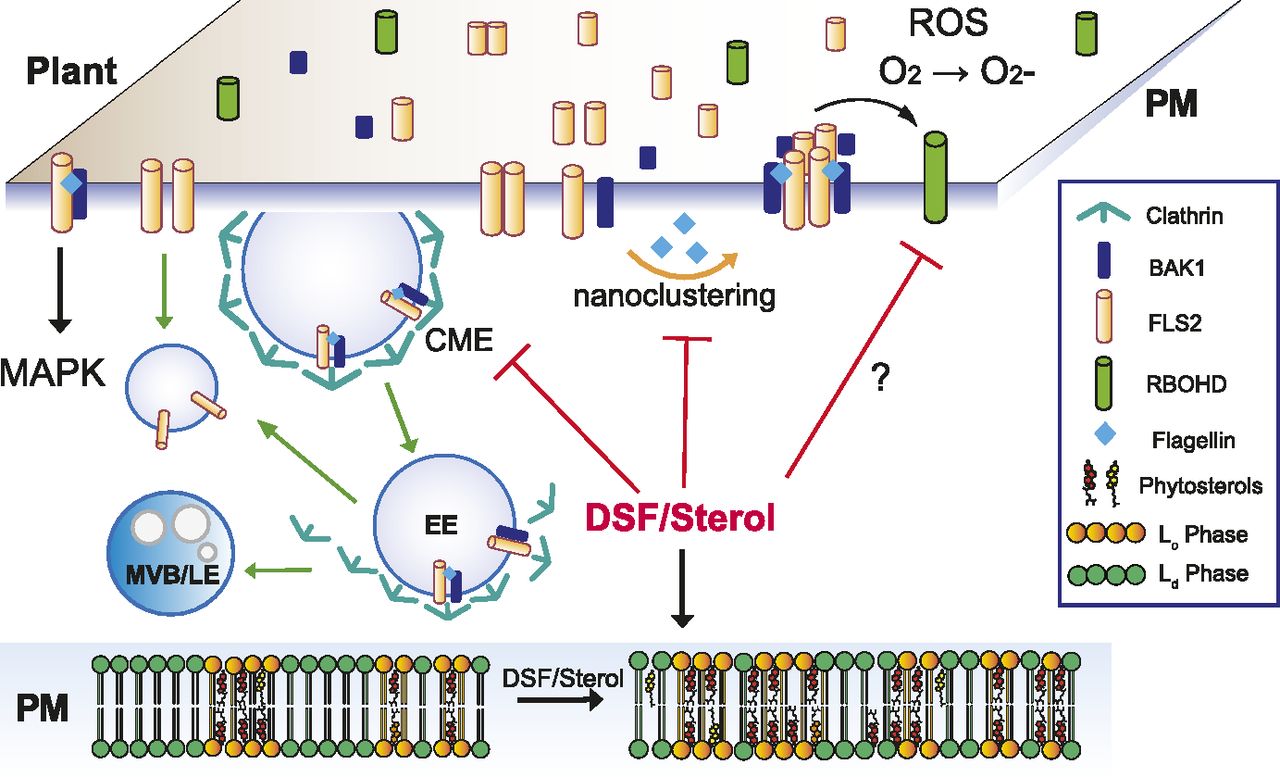
- Figure 6. Proposed model for diffusible signal factor (DSF)–induced suppression of plant innate immunity by perturbation of plasma membrane (PM) lipids.
Upon contact with bacteria/flagellin, FLS2 receptors form heterodimers with interacting partners on the PM and also increased its nano-clustering. Activated receptors then relay the signals to PM co-receptors and cytoplasmic kinases to induce a wide range of defense responses and also undergo endocytosis. In plants infected with DSF-producing bacteria, DSF could be metabolized into plant sterols or directly induce the production of phytosterols via unknown mechanism(s). Sterol enrichment on the plant PM leads to an increase in lipid ordered phase—Lo (or PM nanodomains) and a decrease in lipid disordered phase (Ld phase), and receptor nano-clustering was affected as a result. The behaviors of other pattern-recognition receptors and reactive oxygen species production mediated by RBOHD activity could potentially be impaired by DSF via the disruption of the protein clustering on plant PM. Therefore, signaling cascades from PM that result in PTI responses were attenuated.


Supplementary Materials
Supplemental Data 1.
Lipidomic profile of Arabidopsis Col-0 seedlings grown on 1/2 MS agar plates supplemented with DMSO, diffusible signal factor (DSF), MβCD, and DSF+ MβCD. Plants were grown vertically on 1/2 MS agar amended with appropriate chemicals in each treatment for 7 d before tissues were collected for lipid extraction and analysis. Plants pooled together in one plate are considered a biological replicate, with n = 6 biological replicates for each treatment.[LSA-2020-00720_Supplemental_Data_1.xlsx]
Supplemental Data 2.
Relative fold-change of lipidomic profile of Arabidopsis Col-0 seedlings grown on diffusible signal factor (DSF), MβCD, and DSF+ MβCD compared with DMSO control. P-values were determined by one-sample t test to determine if sample means are different than one at the confidence interval of 90%.[LSA-2020-00720_Supplemental_Data_2.xlsx]
Table S1 Key resource table.


In this Issue
Related Articles
Cited By...
- No citing articles found.