Advertisement

Main menu

  • Home
  • Articles
    • Newest Articles
    • Current Issue
    • Archive
    • Subjects
  • Submit
    • Submit a Manuscript
    • Author Guidelines
    • License, Copyright, Fee
    • FAQ
    • Why Submit
  • About
    • About Us
    • Editors & Staff
    • Board Members
    • Licensing and Reuse
    • Reviewer Guidelines
    • Privacy Policy
    • Advertise
    • Contact Us
    • LSA LLC
  • Alerts
  • Other Publications
    • EMBO Press
    • The EMBO Journal
    • EMBO reports
    • EMBO Molecular Medicine
    • Molecular Systems Biology
    • Rockefeller University Press
    • Journal of Cell Biology
    • Journal of Experimental Medicine
    • Journal of General Physiology
    • Cold Spring Harbor Laboratory Press
    • Genes & Development
    • Genome Research

User menu

  • My alerts

Search

  • Advanced search
Life Science Alliance
  • Other Publications
    • EMBO Press
    • The EMBO Journal
    • EMBO reports
    • EMBO Molecular Medicine
    • Molecular Systems Biology
    • Rockefeller University Press
    • Journal of Cell Biology
    • Journal of Experimental Medicine
    • Journal of General Physiology
    • Cold Spring Harbor Laboratory Press
    • Genes & Development
    • Genome Research
  • My alerts
Life Science Alliance

Advanced Search

  • Home
  • Articles
    • Newest Articles
    • Current Issue
    • Archive
    • Subjects
  • Submit
    • Submit a Manuscript
    • Author Guidelines
    • License, Copyright, Fee
    • FAQ
    • Why Submit
  • About
    • About Us
    • Editors & Staff
    • Board Members
    • Licensing and Reuse
    • Reviewer Guidelines
    • Privacy Policy
    • Advertise
    • Contact Us
    • LSA LLC
  • Alerts
  • Follow lsa Template on Twitter
Methods
Transparent Process
Open Access

De novo prediction of cell-type complexity in single-cell RNA-seq and tumor microenvironments

View ORCID ProfileJun Woo, View ORCID ProfileBoris J. Winterhoff, View ORCID ProfileTimothy K. Starr, Constantin Aliferis, View ORCID ProfileJinhua Wang  Correspondence email
Jun Woo
1Institute for Health Informatics, University of Minnesota, Minneapolis, MN, USA
2Masonic Cancer Center, University of Minnesota, Minneapolis, MN, USA
  • Find this author on Google Scholar
  • Find this author on PubMed
  • Search for this author on this site
  • ORCID record for Jun Woo
Boris J. Winterhoff
2Masonic Cancer Center, University of Minnesota, Minneapolis, MN, USA
3Department of Obstetrics, Gynecology and Women's Health, University of Minnesota, Minneapolis, MN, USA
  • Find this author on Google Scholar
  • Find this author on PubMed
  • Search for this author on this site
  • ORCID record for Boris J. Winterhoff
Timothy K. Starr
2Masonic Cancer Center, University of Minnesota, Minneapolis, MN, USA
3Department of Obstetrics, Gynecology and Women's Health, University of Minnesota, Minneapolis, MN, USA
  • Find this author on Google Scholar
  • Find this author on PubMed
  • Search for this author on this site
  • ORCID record for Timothy K. Starr
Constantin Aliferis
1Institute for Health Informatics, University of Minnesota, Minneapolis, MN, USA
  • Find this author on Google Scholar
  • Find this author on PubMed
  • Search for this author on this site
Jinhua Wang
1Institute for Health Informatics, University of Minnesota, Minneapolis, MN, USA
2Masonic Cancer Center, University of Minnesota, Minneapolis, MN, USA
  • Find this author on Google Scholar
  • Find this author on PubMed
  • Search for this author on this site
  • ORCID record for Jinhua Wang
  • For correspondence: wangjh@umn.edu
Published 2 July 2019. DOI: 10.26508/lsa.201900443
  • Article
  • Figures & Data
  • Info
  • Metrics
  • Reviewer Comments
  • PDF
Loading

Article Figures & Data

Figures

  • Supplementary Materials
  • Figure 1.
    • Download figure
    • Open in new tab
    • Download powerpoint
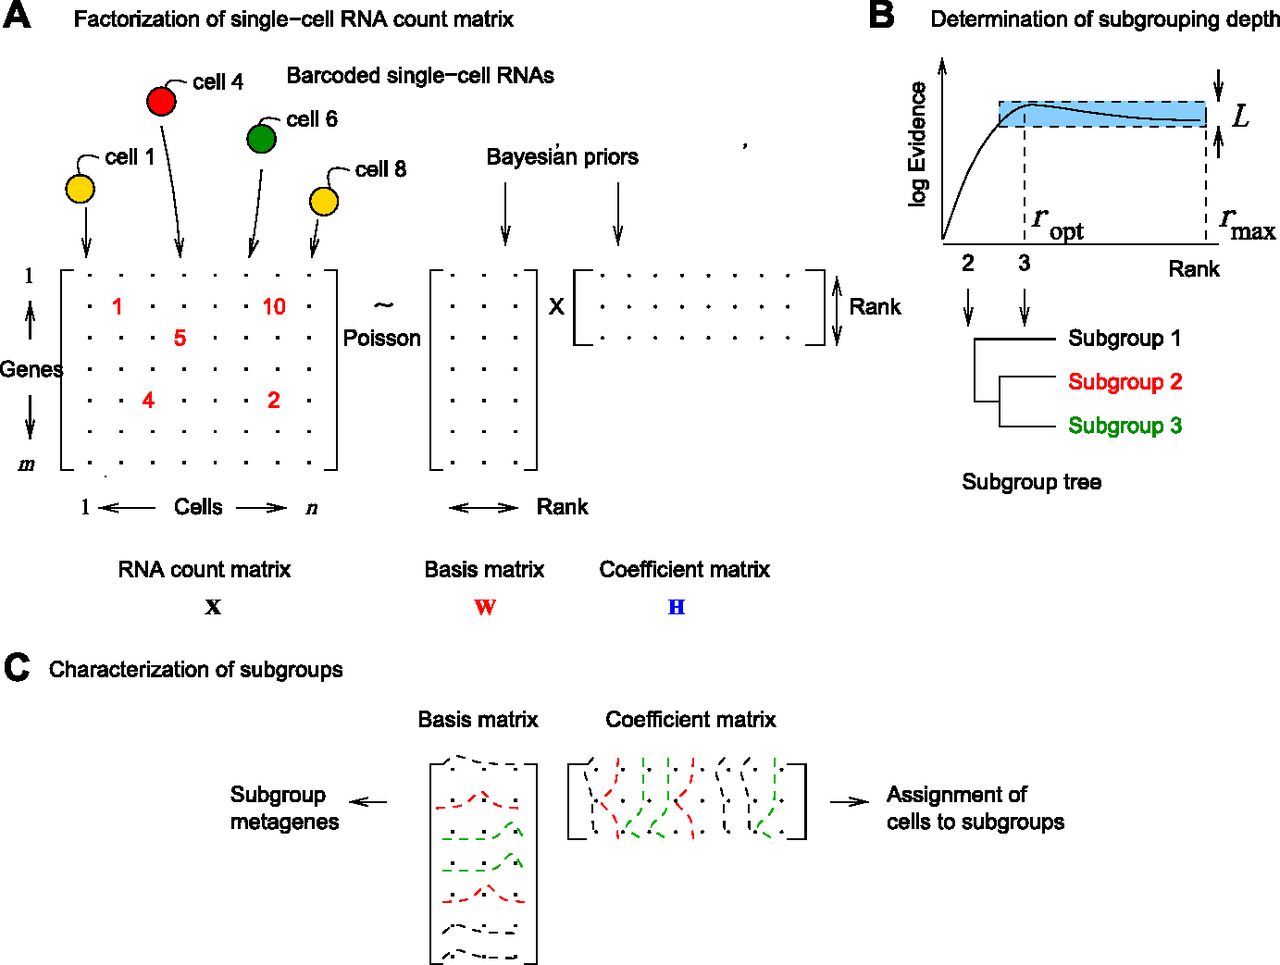
    Figure 1. bNMF for single-cell RNA-seq clustering.

    (A) RNA count matrix derived from droplet-based single-cell RNA-seq data is modeled as a Poisson realization of the mean given by a product of basis W and coefficient H matrices sharing a common dimension rank. Factorization infers these matrices for varying rank values using gamma priors. (B) We find the optimal rank maximizing log evidence or marginal likelihood of hyperparameters given the data. Heterogeneity class is determined by the shape of evidence profile: in type I, the difference in evidence between the maximum at rank ropt and the value at rmax is larger than the threshold L; in type II, this difference is within L. The threshold is given by L=(ln⁡T)/m, where T is the lower bound of Bayes factor for statistical significance. The factorization solutions for ranks from 2 to ropt are then used to construct the subgroup tree, which connects subgroups under successively increasing ranks. This tree provides a global view on the structure of cell-type heterogeneity on varying resolution. (C) Factor matrices W and H corresponding to the optimal rank are used to identify metagenes (genes distinguishing a given subgroup from the rest), characterize subgroups into known or novel cell types, and to assign individual cells into subgroups.

  • Figure 2.
    • Download figure
    • Open in new tab
    • Download powerpoint
    Figure 2. Comparison of optimal rank determination by NMF (ML-NMF and bNMF) and other clustering methods.

    (A–D) Simulated data of 100 genes and 10 subgroups of cells (20 in each subgroup; 200 in total, except noted otherwise in (C)). ML-NMF narrows down the rank into an optimal range based on two quality measures, dispersion and cophenetic coefficient. (C) bNMF finds the correct rank 10 maximizing evidence. (D) Seurat (Macosko et al, 2015) requires specification of resolution parameter; the correct number of subgroups is reached as the upper bound with respect to resolution. (E, F) ML-NMF applied to PBMC single-cell data (Zheng et al, 2017). (G) bNMF applied to PBMC data sets of different sizes led to the optimal rank maximizing evidence as ropt≈9. (H) PCA applied to PBMC yielded a wide range of subgroup numbers depending on resolution. (I–N) bNMF rank profiles and the number of clusters predicted by other computational algorithms applied to six gold standard data sets (Yan et al, 2013; Biase et al, 2014; Deng et al, 2014; Pollen et al, 2014; Kolodziejczyk et al, 2015; Goolam et al, 2016). The SC3 (Kiselev et al, 2017), SINCERA (Guo et al, 2015), and SNN-Cliq (Xu & Su, 2015) predictions are from Kiselev et al, 2017. The black dotted and red dashed lines are the number of major cell types expected from experimental design and the optimal rank from bNMF protocol, respectively. In (I), the total number of cells was small (n = 49) so that a large subset of factorization results in W matrices had uniform columns for r ≥ 4, implying ropt = 3.

  • Figure S1.
    • Download figure
    • Open in new tab
    • Download powerpoint
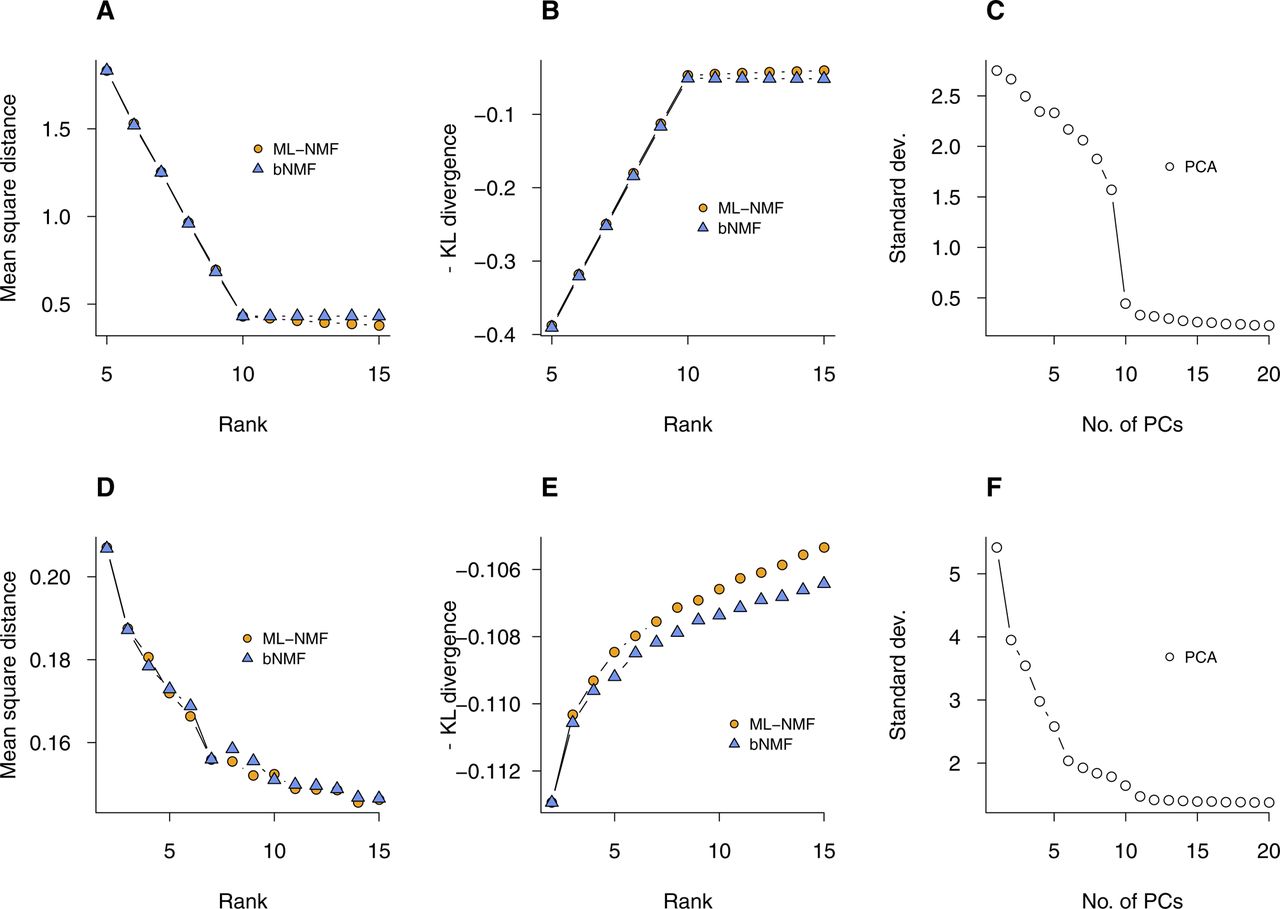
    Figure S1. Quality measures from ML-NMF and bNMF for simulated and PBMC data.

    See Fig 2. (A–C) Euclidean distance, negative generalized Kullback–Leibler (KL) divergence, and SD from ML-NMF, bNMF, and PCA-based Seurat, applied to simulated data of Fig 2A–D. (D–F) Analogous results for PBMC data (Fig 2E–H).

  • Figure S2.
    • Download figure
    • Open in new tab
    • Download powerpoint
    Figure S2. Outlier cells in bNMF factorization.

    (A, B) A simulated data set generated as in Fig 2A–D was used with rank 5 and factorized using bNMF. (C) Outliers (white symbols) were identified using minimum covariance determinant method (Hubert & Debruyne, 2010).

  • Figure S3.
    • Download figure
    • Open in new tab
    • Download powerpoint
    Figure S3. Convergence of bNMF algorithm tested with simulated data sets.

    Two factor matrices W and H with dimensions 100 × 5 and 5 × n (n = 10, 100, and 1,000) were generated by sampling their elements from gamma priors Pr(w)∼ waw−1e−aww/bw and Pr(h)∼ hah−1e−ahh/bh, such that E(w)=bw, E(h)=bh, and aw, ah control variances. The hyperparameters were set as aw=ah=0.1 and bw=bh=1. (A, B) With increasing sample sizes, log evidence becomes increasingly narrower, peaked at rank 5. (C, D) Distribution of optimal rank over 200 realizations of matrices under n = 10 and 100 (n = 1,000 is similar to (D)). (E, F) Distributions of converged hyperparameters.

  • Figure S4.
    • Download figure
    • Open in new tab
    • Download powerpoint
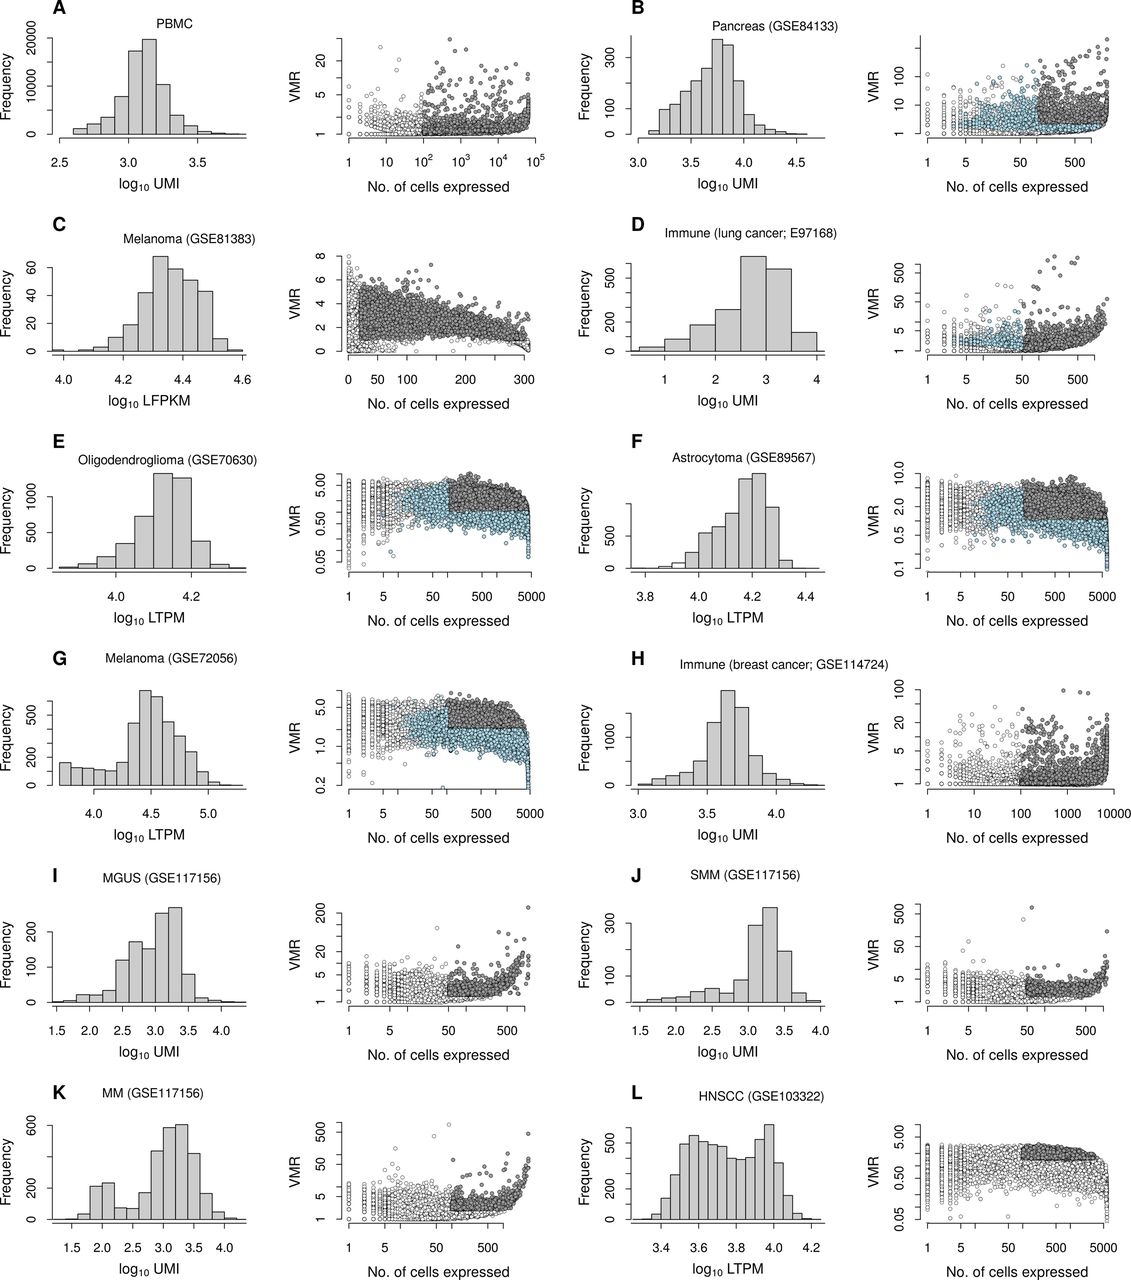
    Figure S4. Distributions of total RNA count and expression variances for data sets used.

    (A–L) Total RNA counts for cells and VMR of genes are shown in the left and right columns, respectively. Filled circles are genes selected for downstream analysis, which include genes with VMR and number of cells expressing genes above thresholds (gray), and additional genes with modes in their count distribution (light blue), if included. See Table S1. LFPKM, log2 (1 + FPKM); FPKM, fragments per kilobase per million reads; LTPM, log2 (1 + TPM); TPM, transcripts per million reads.

  • Figure 3.
    • Download figure
    • Open in new tab
    • Download powerpoint
    Figure 3. bNMF subgrouping results for PBMC and pancreas data sets.

    (A–C) Results for the PBMC data set (n = 34,289). (A) Metagenes for subgroups derived from the factor matrix W under optimal rank 9 (Fig 2G). Heat map shows the relative magnitudes of matrix element Wik for each gene i and subgroup k, rescaled such that in each row, minimum and maximum correspond to 0 and 1. Up to 10 metagenes in addition to preselected markers per subgroup are shown. (B) Subgroup tree showing hierarchical relationships between subgroups under varying ranks from the lowest (2) to the optimal (9). Branching of a subgroup under a given rank into two under a successively larger rank was inferred by applying the majority rule (see the Materials and Methods section). (C) Visualization of subgroups with tSNE. Subgroup ID and composition of cells are indicated. (D, E) Comparison of cell type compositions predictedby bNMF and bulk data deconvolution method, CIBERSORT (Newman et al, 2015). Outcomes for the full fresh PBMC data and an example mixture of seven purified cell types are shown in (D) and (E), respectively. (F) Subgrouping of human pancreas cell data (Baron et al, 2016). Colors indicate major cell types. Insulin-producing β-cells are in yellow (see Figs S5 and S6 and Table S2). MT, metallothionein. (G) Mean RNA count of INS gene in each pancreas subgroup.

  • Figure S5.
    • Download figure
    • Open in new tab
    • Download powerpoint
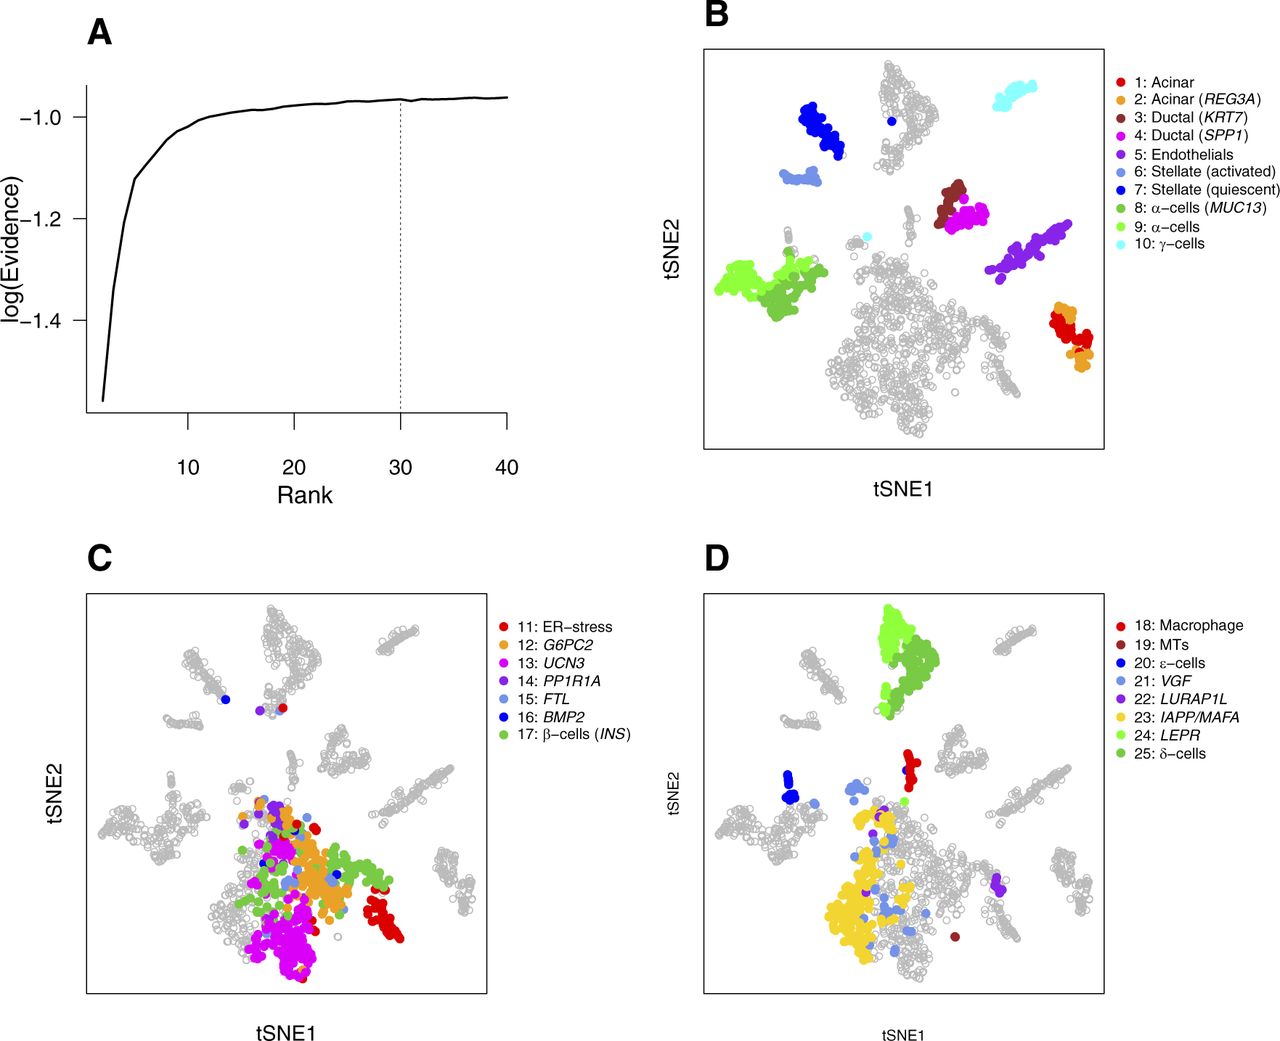
    Figure S5. bNMF clustering outcomes of human pancreatic cells (Baron et al, 2016).

    (A) Rank versus evidence profile. The heterogeneity class is type II and ropt = 30. (B–D) tSNE visualization of 25 subgroups. See Fig 3F and G.

  • Figure S6.
    • Download figure
    • Open in new tab
    • Download powerpoint
    Figure S6. Top 20 metagenes of 25 subgroups derived from human pancreatic cell data (Baron et al, 2016).

    Scores are magnitudes of coefficient matrix H elements rescaled by the geometric mean within each row corresponding to genes.

  • Figure 4.
    • Download figure
    • Open in new tab
    • Download powerpoint
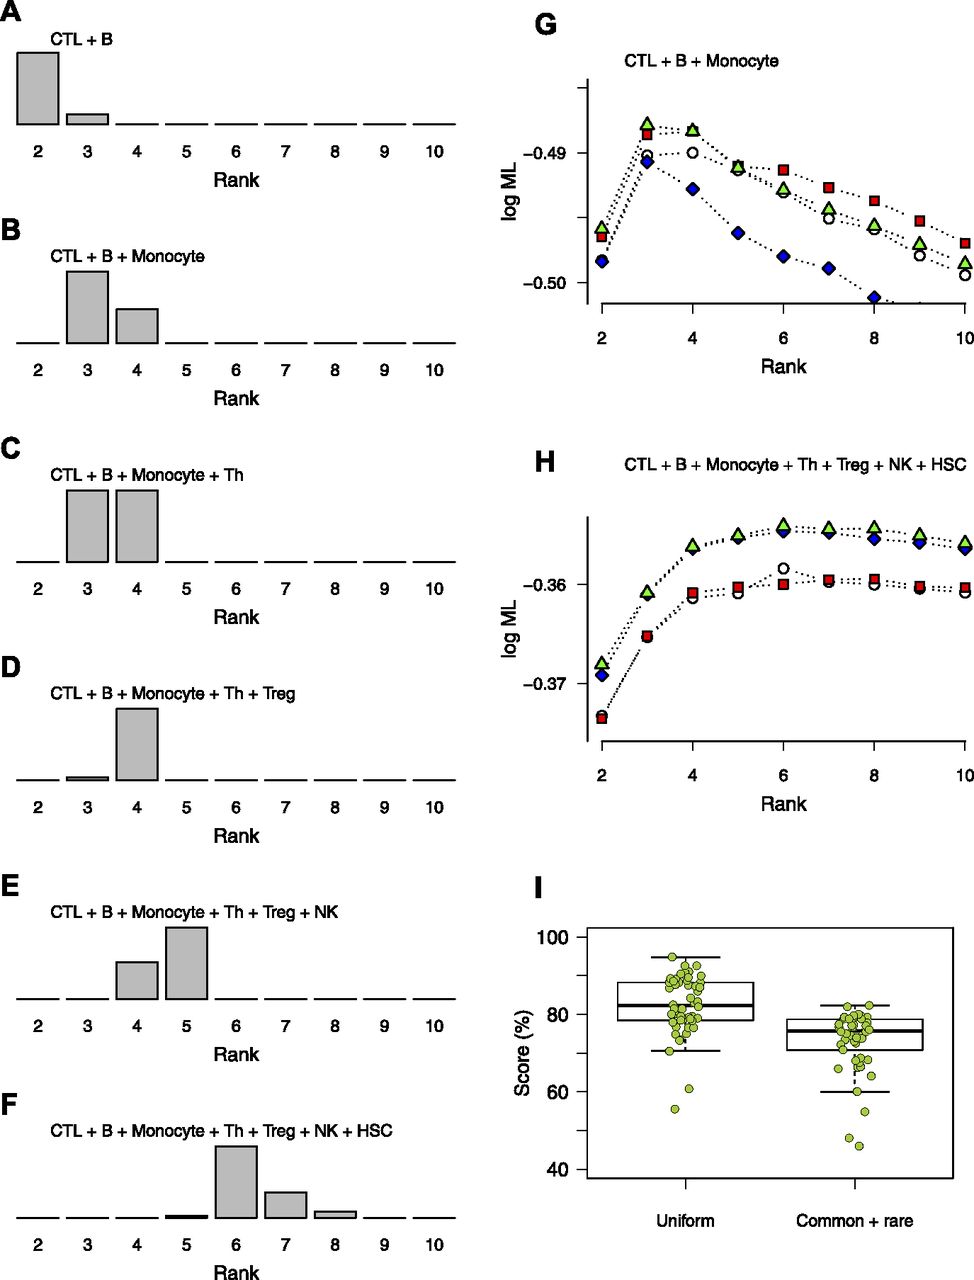
    Figure 4. Distributions of optimal ranks from bNMF inference applied to randomly sampled mixtures of purified blood cells.

    (A–F) Mixtures containing selections of CD8+ T cells (CTL), B cells (B), monocytes, CD4+ T cells (Th), regulatory T cells (Treg), NK cells (NK), and CD34+ HSCs, of varying compositions as indicated. (G, H) Examples of rank versus evidence profiles for mixtures of three (G) and seven (H) blood cell types. (I) Subgroup assignment scores (fraction of correctly assigned cells) of bNMF-based inferences applied to mixtures of four purified blood cell types shown in (C). Two sets of mixtures with different compositions were sampled, one with uniform cell counts (“uniform”) and the other where three cell types were ∼10% in count than the rest (“common + rare”). Mean scores are 0.82 (0.08, SD) and 0.73 (0.08) for uniform and common + rare cases, respectively.

  • Figure S7.
    • Download figure
    • Open in new tab
    • Download powerpoint
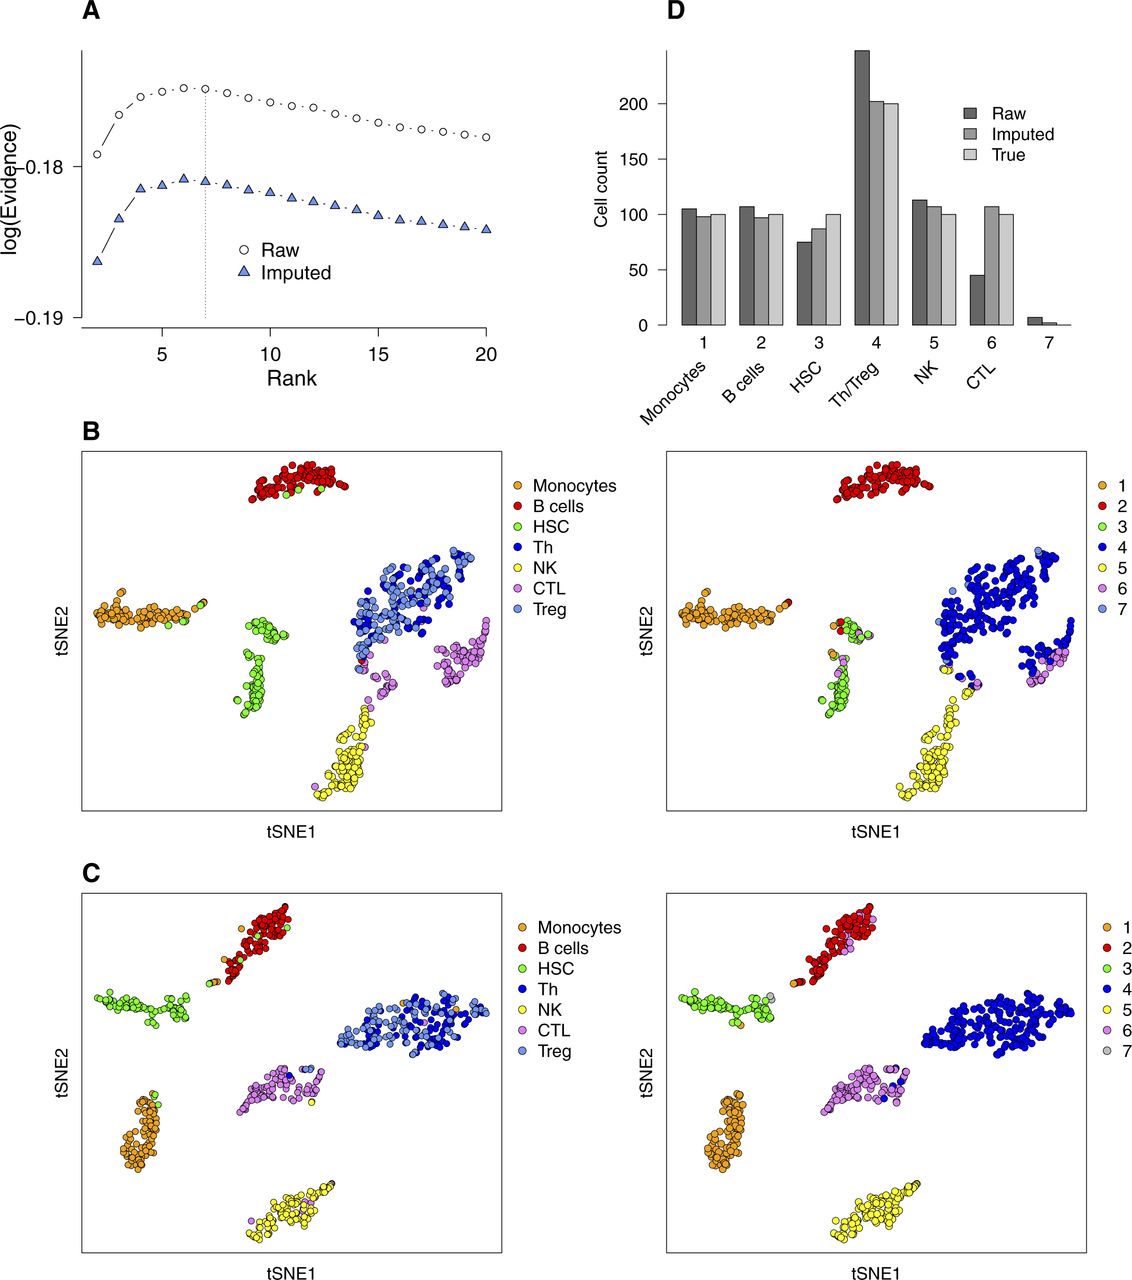
    Figure S7. Comparison of bNMF clustering applied to a PBMC mixture without and with imputation of RNA counts.

    A mixture of seven immune cell types (monocytes, B cells, CD34+ HSCs, helper T cells [Th], natural killer [NK] cells, cytotoxic T lymphocytes [CTL], and Treg; n = 100 each; see Fig 4F) was used. (A) Evidence profiles. (B, C) tSNE maps (derived from raw count matrix, (B); derived from imputed count matrix, (C); colored by cell types of origin [left column] and by cluster assignment from H matrix [right column; rank 7]). Note that Th and Treg cells are grouped together in cluster 4. (D) Cell counts in each cluster.

  • Figure 5.
    • Download figure
    • Open in new tab
    • Download powerpoint
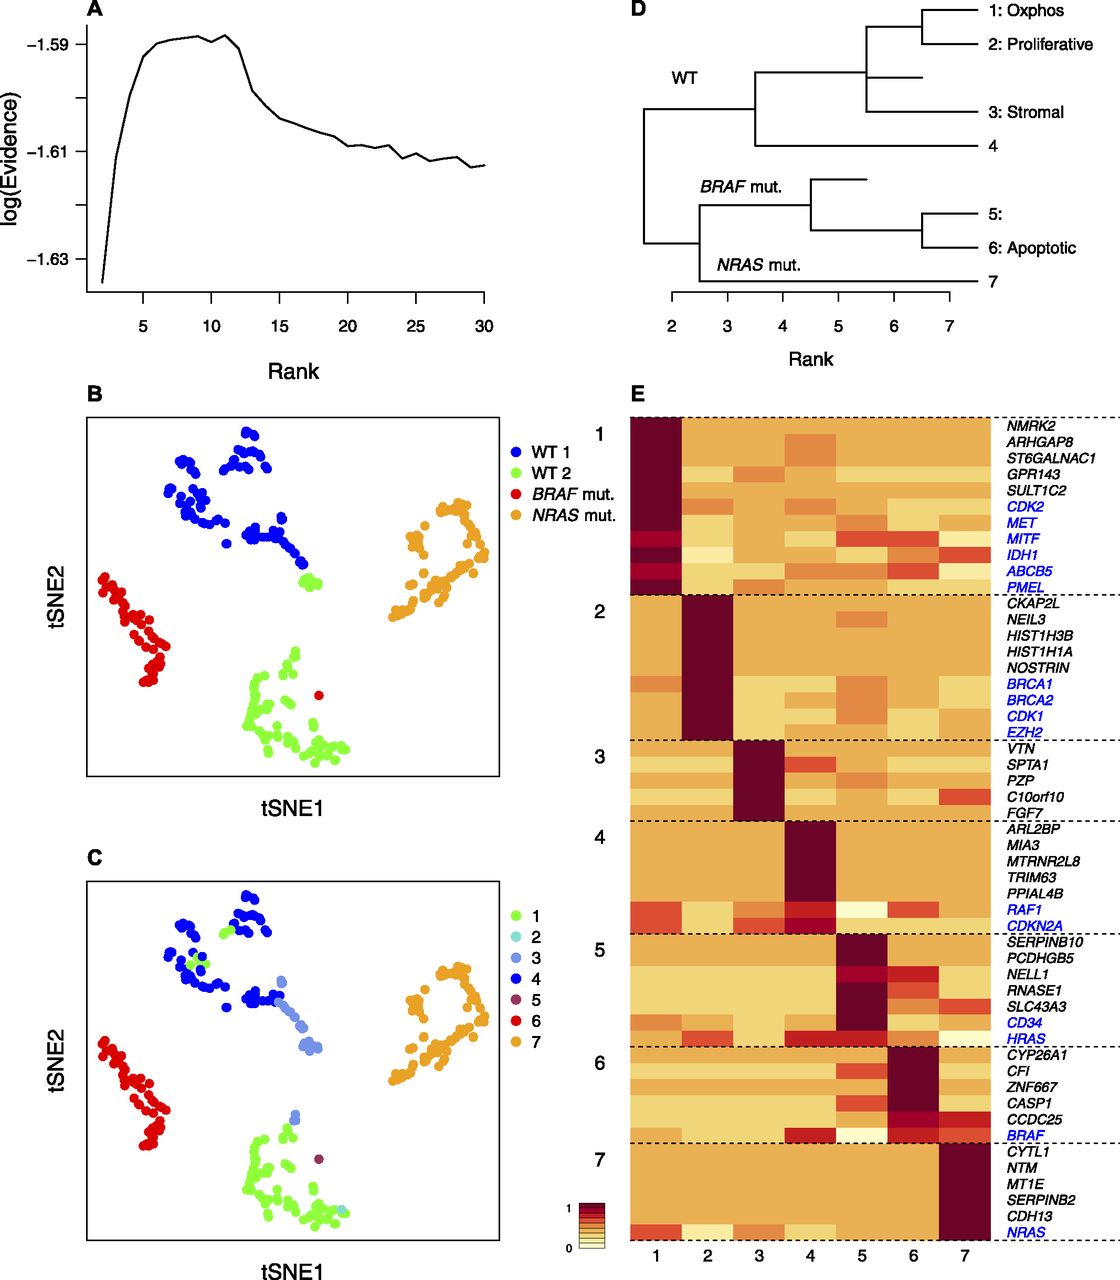
    Figure 5. bNMF subgrouping results of melanoma cell culture transcriptome data (Gerber et al, 2017).

    (A) Rank versus evidence profile. (B, C) tSNE visualizations of cells using bNMF H matrix elements colored by sample of origin in (B) and subgroup identity under rank 7 in (C). (D) Custer tree from rank 2 to 7. Oxphos, oxidative phosphorylation (Gerber et al, 2017). (E) Metagene map showing top five metagenes in each subgroup and marker genes (blue). mut., mutant.

  • Figure 6.
    • Download figure
    • Open in new tab
    • Download powerpoint
    Figure 6. bNMF clustering outcomes for in vivo solid tumor and myeloma samples.

    (A–F) Rank versus evidence profiles of data sets with accession numbers as indicated (Tirosh et al, 2016a, 2016b; Lavin et al, 2017; Puram et al, 2017; Venteicher et al, 2017; Azizi et al, 2018). Dotted blue lines are smooth-spline fits to data. Vertical dashed lines are locations of optimal rank. (G–I) Evidence profiles of MM samples in MGUS, SMM, and full MM stages (Ledergor et al, 2018).

  • Figure S8.
    • Download figure
    • Open in new tab
    • Download powerpoint
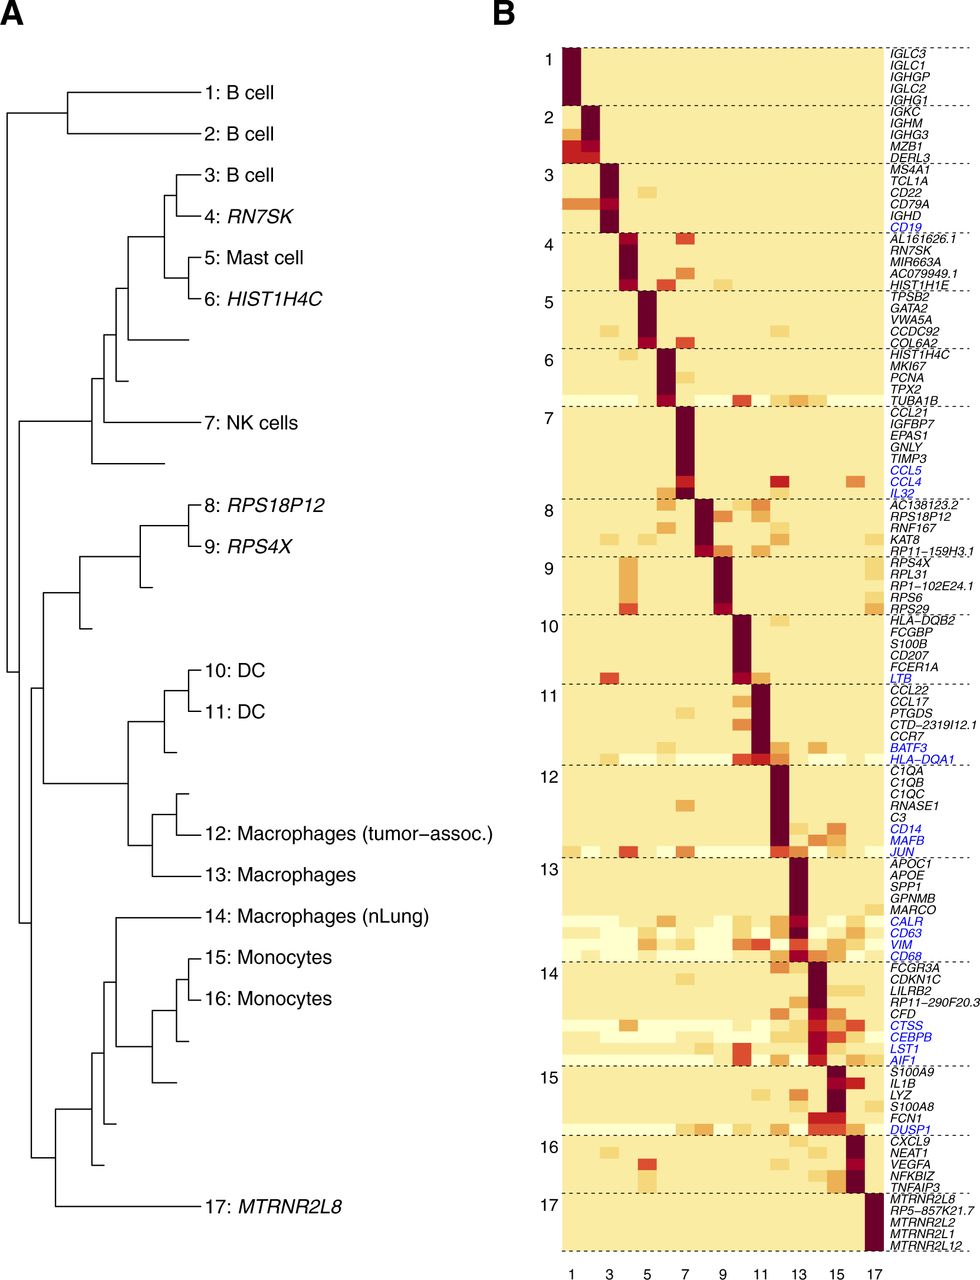
    Figure S8. bNMF clustering outcome for innate immune cell data from lung cancer patients.

    (A) Subgroup tree of connecting r = 2–17 annotated with cell types assigned by marker genes from Lavin et al (2017). (B) Metagene map for 17 subgroups. Genes labeled in blue are marker genes ranked below five.

  • Figure S9.
    • Download figure
    • Open in new tab
    • Download powerpoint
    Figure S9. ML-NMF quality measures of tumor samples, oligodendroglioma (GSE70630) and breast cancer immune cells (GSE114724).

    (A) Dispersion. (B) Cophenetic coefficient. See Figs 2E, F, and 6B and E and Table S1.

  • Figure S10.
    • Download figure
    • Open in new tab
    • Download powerpoint
    Figure S10. bNMF subgroups in head and neck cancer data set (Puram et al, 2017).

    (A) Subgroup tree. (B) Metagene map (top five plus marker genes in blue) for 15 subgroups. (C) tSNE visualization of 15 subgroups. Numbers indicate subgroup labels in (A–B). (D) Cell-type annotation by Puram et al (2017).

  • Figure S11.
    • Download figure
    • Open in new tab
    • Download powerpoint
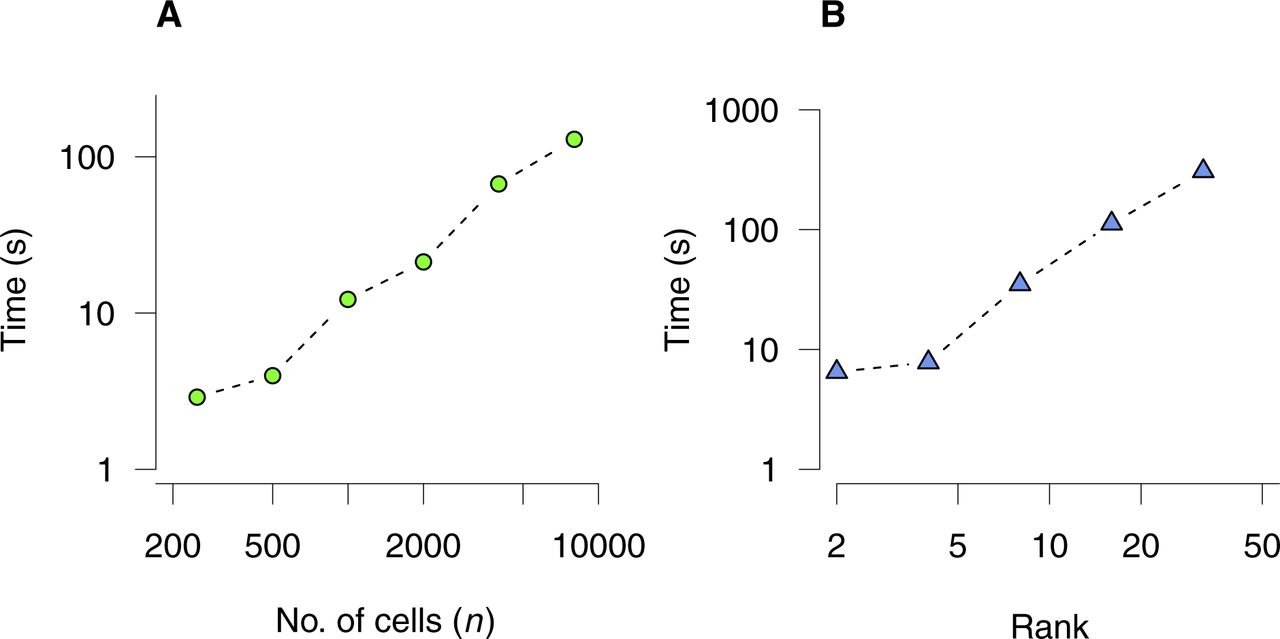
    Figure S11. Computational load for bNMF inference.

    Execution time is shown for factorizing a count matrix using bNMF under a single initial condition until convergence. (A) Matrices with m = 500 rows under rank r = 5 with varying number of cells. (B) Matrices with m = 500 rows and n = 1,000 cells under varying rank values. An Intel Core i5 CPU with 2.5 GHz was used.

Supplementary Materials

  • Figures
  • Table S1 Composition of single-cell data sets used. The numbers of genes and cells indicate those after filtering (see Fig S4).

  • Table S2 Comparison of pancreatic cell-type assignments. Columns are from Baron et al (2016) (human sample 1) and rows are from bNMF inference (see Figs 3F and S5).

PreviousNext
Back to top
Download PDF
Article Alerts
Sign In to Email Alerts with your Email Address
Email Article

Thank you for your interest in spreading the word on Life Science Alliance.

NOTE: We only request your email address so that the person you are recommending the page to knows that you wanted them to see it, and that it is not junk mail. We do not capture any email address.

Enter multiple addresses on separate lines or separate them with commas.
De novo prediction of cell-type complexity in single-cell RNA-seq and tumor microenvironments
(Your Name) has sent you a message from Life Science Alliance
(Your Name) thought you would like to see the Life Science Alliance web site.
CAPTCHA
This question is for testing whether or not you are a human visitor and to prevent automated spam submissions.
Citation Tools
Prediction of cell-type complexity in single-cell RNA-seq
Jun Woo, Boris J. Winterhoff, Timothy K. Starr, Constantin Aliferis, Jinhua Wang
Life Science Alliance Jul 2019, 2 (4) e201900443; DOI: 10.26508/lsa.201900443

Citation Manager Formats

  • BibTeX
  • Bookends
  • EasyBib
  • EndNote (tagged)
  • EndNote 8 (xml)
  • Medlars
  • Mendeley
  • Papers
  • RefWorks Tagged
  • Ref Manager
  • RIS
  • Zotero
Share
Prediction of cell-type complexity in single-cell RNA-seq
Jun Woo, Boris J. Winterhoff, Timothy K. Starr, Constantin Aliferis, Jinhua Wang
Life Science Alliance Jul 2019, 2 (4) e201900443; DOI: 10.26508/lsa.201900443
del.icio.us logo Digg logo Reddit logo Twitter logo CiteULike logo Facebook logo Google logo Mendeley logo
  • Tweet Widget
  • Facebook Like
Issue Cover

In this Issue

Volume 2, No. 4
August 2019
  • Table of Contents
  • Cover (PDF)
  • About the Cover
  • Masthead (PDF)
Advertisement

Jump to section

  • Article
    • Abstract
    • Introduction
    • Results
    • Discussion
    • Materials and Methods
    • Acknowledgments
    • References
  • Figures & Data
  • Info
  • Metrics
  • Reviewer Comments
  • PDF

Subjects

  • Cancer

EMBO Press LogoRockefeller University Press LogoCold Spring Harbor Logo

Content

  • Home
  • Newest Articles
  • Current Issue
  • Archive
  • Subject Collections

For Authors

  • Submit a Manuscript
  • Author Guidelines
  • License, copyright, Fee

Other Services

  • Alerts
  • Twitter
  • RSS Feeds

More Information

  • Editors & Staff
  • Reviewer Guidelines
  • Feedback
  • Licensing and Reuse
  • Privacy Policy

ISSN: 2575-1077
© 2021 Life Science Alliance LLC

Life Science Alliance is registered as a trademark in the U.S. Patent and Trade Mark Office and in the European Union Intellectual Property Office.