


Article Figures & Data
Figures
- Figure 1. Oligomerization state of KAP1.
(A) KAP1 sequence architecture. The different KAP1 domains are reported on top. The structures of the individual RING, B-box 1, and B-box 2 domains as well as the PHD-Br domain have been solved by X-ray crystallography and NMR, respectively (PDB IDs 6I9H (29), 6O5K (33), 2YVR, and 2RO1 (36)). Key residues affected by PTM are also highlighted (phosphorylation sites in black and SUMOylation in white). (B) Schematic of the different constructs used in this study. (C) SEC-MALS analyses of the KAP1 constructs show that they are all dimers. The traces are colored according to the KAP1 construct and show the normalized elution profile measured at 280 nm (right axis) and the calculated molecular weight of the selected peaks in kDa (left axis): 88 kDa for the RBCC domain, 183 kDa for ΔKAP1, and 190 kDa for KAP1 FL
- Figure S1. AUC analysis of the KAP1 RBCC domain.
The top panel shows the raw sedimentation velocity data, shown as fringe displacements (which is proportional to the protein concentration) plotted against the distance from the axis of rotation. The center panel shows the residuals after fitting to a continuous concentration versus molecular mass, c(M), model. The RMSD for the fit was 0.0546 and the sedimentation coefficient was 2.3 S. The bottom panel shows the distribution of s values obtained from the sedimentation velocity data. Data analysis was performed using the program sedfit (1). HYDROPRO calculated an Rg of 79.8 Å and an s value of 2.59 S for the RBCC model, in agreement with our experimental values.
- Figure 2. Overall architecture of KAP1.
(A) SAXS scattering curves. (B) Pair-distance distribution functions. (C) Ab initio bead models created using GASBOR (65) shown in surface representation. (D) Representative TEM image of negatively stained KAP1 FL and gallery of 2D class averages. (E) A representative atomic model of the antiparallel RBCC dimer (different protomers are colored in blue and grey) capturing the main features of the ensemble of models able to fit the SAXS data (see Fig S6). The end of the RBCC contains the TIF1 signature sequence (TSS) domain, which is rich in phenylalanine and tryptophan residues (2) and is modeled as a helix that packs against the main long CC domain forming overall a four-helix bundle. (F) Fit of representative scattering profiles of the molecular models shown in Fig S6 (in blue) to the SAXS scattering data (in grey) using Pepsi-SAXS (66) (fitting with 0.8 < χ2 < 1).
- Figure S2. Integrative modeling analysis of ΔKAP1.
(A) 1-dimensional scattering curve. (B) Pair distance distribution function (P(r)) calculated from the SAXS scattering profile. (C) χ2 plots (left) and Rg plots (right) of the initial (blue) versus final (red) model structures, with narrower distributions centered on χ2 = 1 and the experimental Rg (see Table S1). (D) Plot of the initial randomized models versus the final fit models according to their dA versus dB distance values. The centroids of the clusters are highlighted by white dots. (E) Cartoon representation of the centroid model of KAP1 representative of the ensemble with the most probable domain arrangement. (F) GASBOR ab initio bead model of ΔKAP1 shown in surface representation.
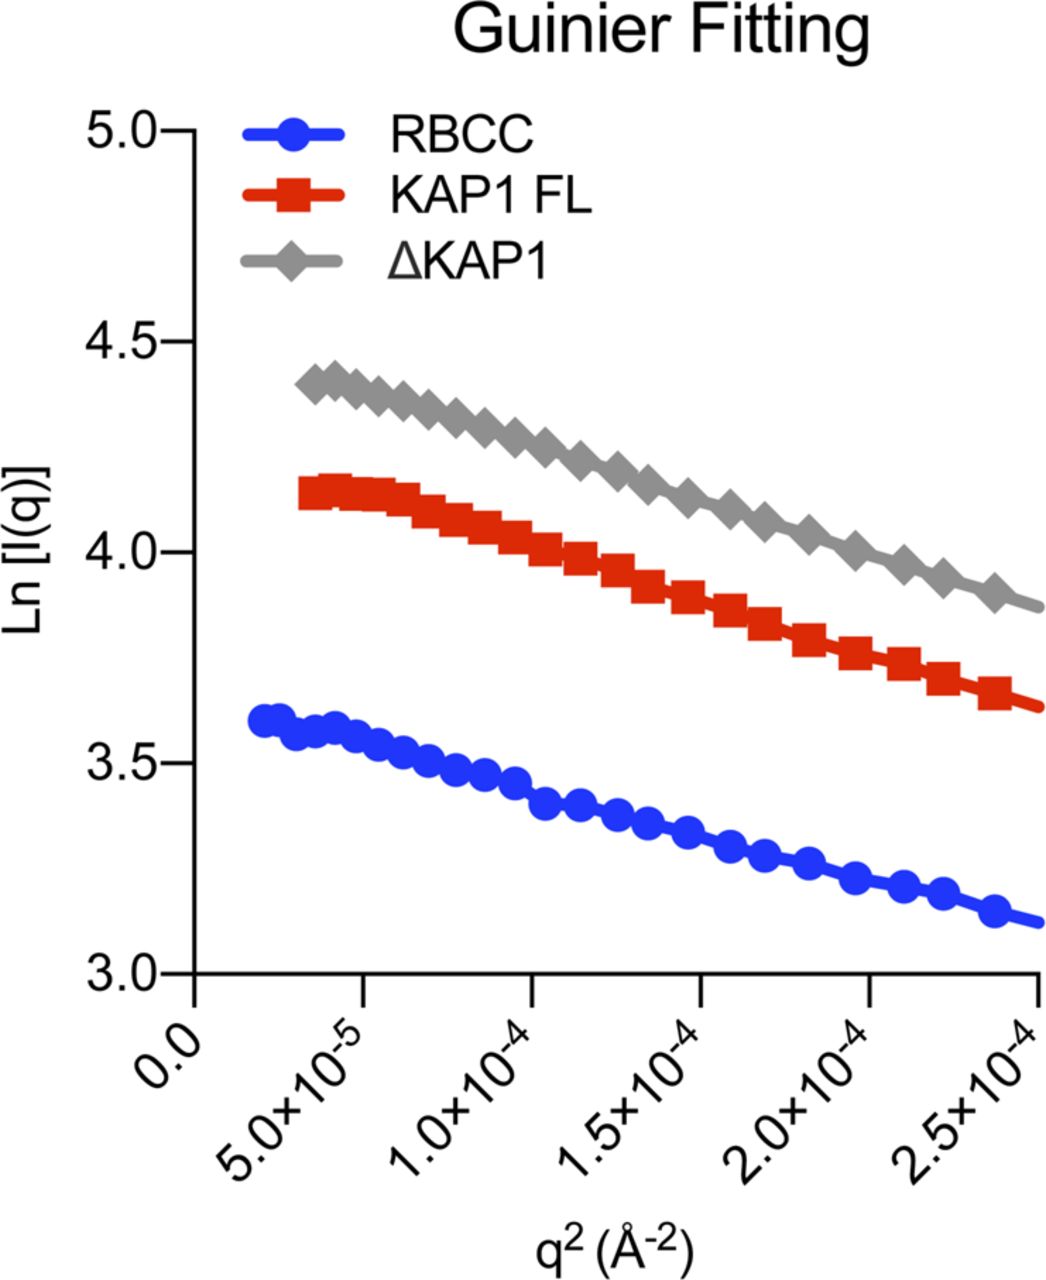
- Figure S3. Guinier plots.
Displaying good linearity indicating non-aggregated samples.
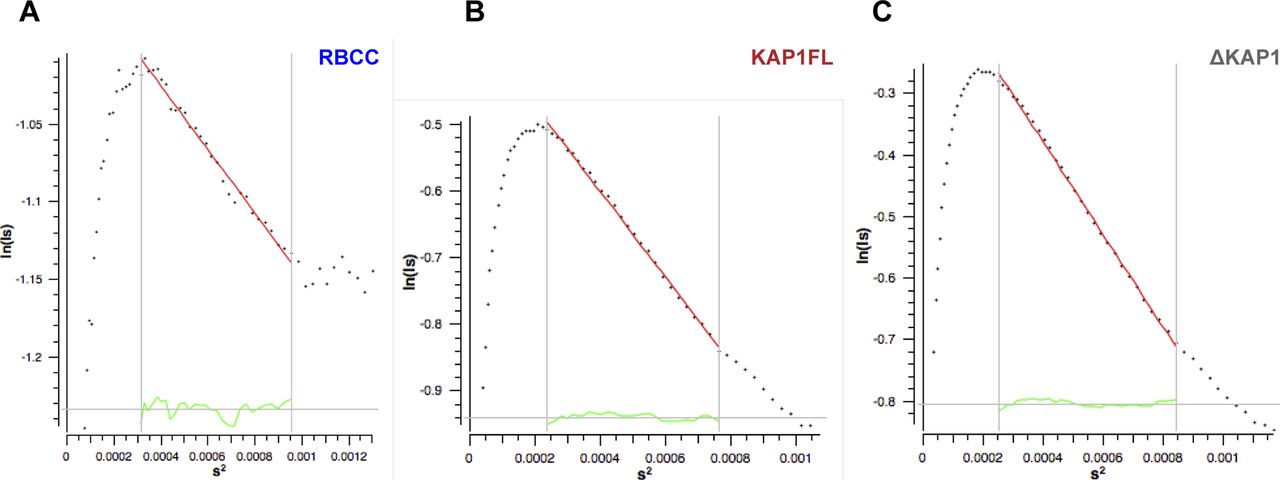
- Figure S4. Cross-section Rg (Rgc) plots show that the KAP1 variants are elongated rod-like molecules.
(A) Rgc plot of the RBCC domain. (B) Rgc plot of KAP1 FL. (C) Rgc plot of ΔKAP1. Values are shown in Table S1 and were calculated using Primus (2), with s = q = 4πsin (θ)/λ, where θ is the scattering angle and λ is the wavelength of the x-rays.
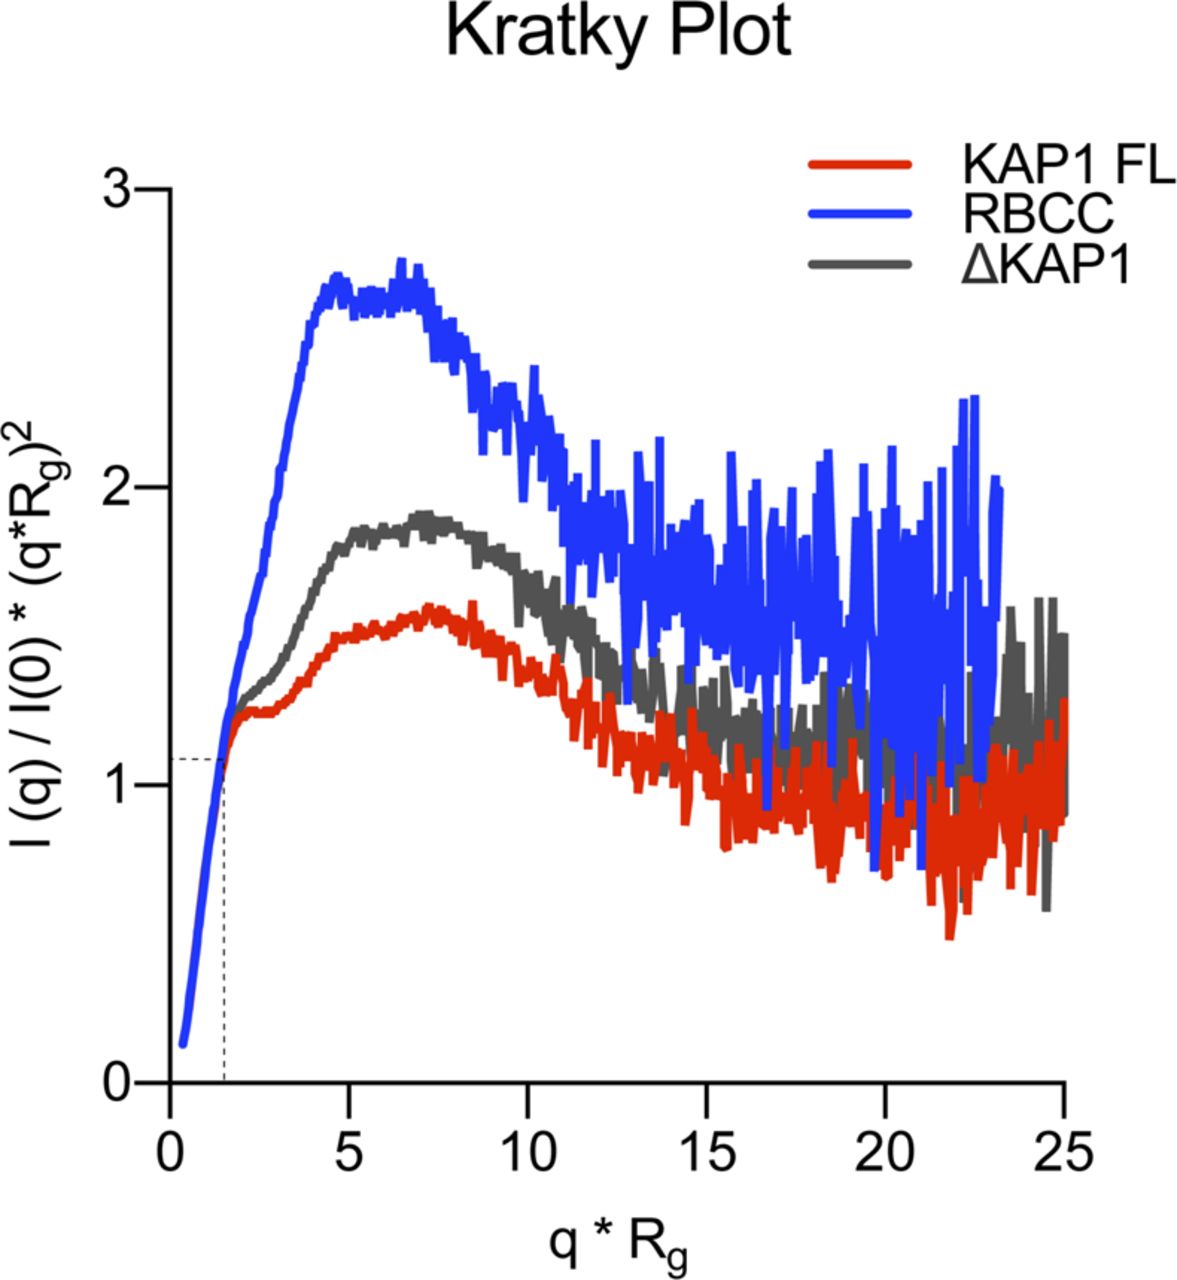
- Figure S5. Kratky plot of the KAP1 variants.
Dimensionless Kratky Plots produced with ScÅtter (3) showing that all KAP1 constructs are flexible multidomain proteins. In dimensionless Kratky plots, globular proteins always have a maximum at q × Rg = 31/2 and (q × Rg)2I(q)/I(0) = 1.104, which is shown by the dotted lines.
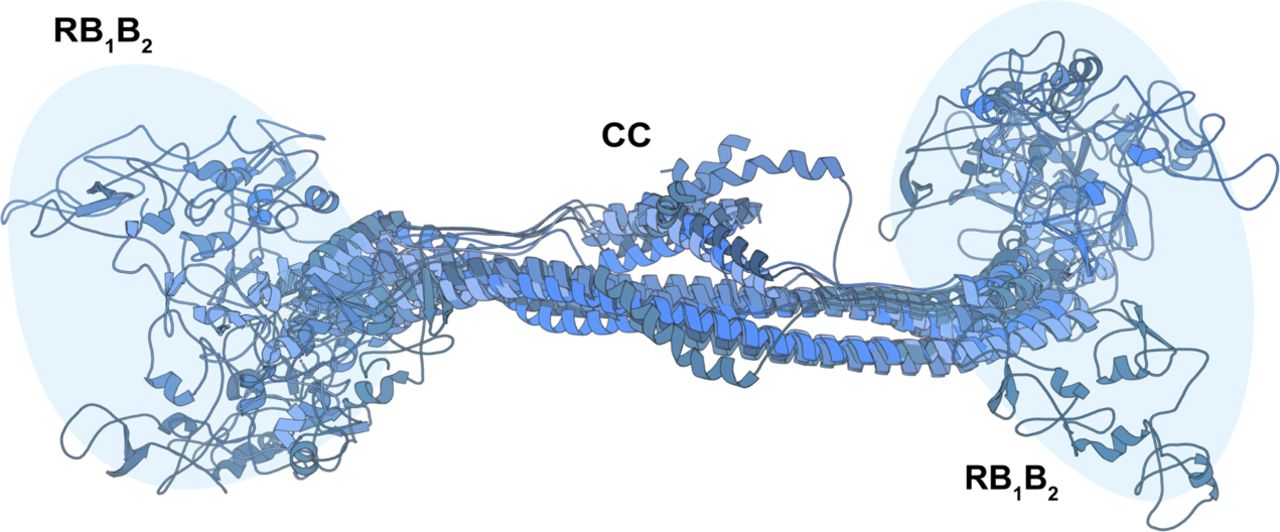
- Figure S6. Ensemble of representative RBCC models that fit the SAXS data (see Fig 2 of the main text).
- Figure 3. Native asymmetry of KAP1.
(A) χ2 (left) and Rg (Å) plots (right) of the initial (blue) versus final (red) model structures, with final distributions centered around χ2 = 1 and the experimental Rg (90 Å). (B) Schematic representation of the KAP1 FL dimer where the distances, D (maximum initial distance), dA1,2, and dB1,2 are displayed. (C) Plot of the initial versus final models according to their dA versus dB distance values. The centers of the clusters are highlighted by white dots. (D) 1D density distribution of the clustered models according to the distances between the PHD-Br and the RB1B2 domains showing two clear Gaussian distributions (see also Fig S7). The dotted lines show the limits of the first density level containing 10% of the models. (E) Cartoon representation of the cluster center model of KAP1 FL representative of the ensemble that optimally fits the SAXS data. The ensemble of selected models belonging to the first density level in D is shown in Fig S7B. (F) Comparison between the SAXS scattering profile (grey) and the calculated scattering profiles (red) from the models in the first density level using Pepsi-SAXS (0.8 < χ2 < 2).
- Figure S7. Asymmetric domain arrangement in KAP1.
(A) Superposition of the two equivalent clusters of NMA fitted models (see Fig 3C). The density level depicted by a solid line contains the 300 closest models to the cluster center, shown as white dots. The cluster center is shown as a bigger white dot. (B) Cartoon representation of a selection of models belonging to the first density level. (C) Superimposition of the 300 closest models to the cluster center. For each model, the PHD-Br domain nearest to an RB1B2 module is shown in red, whereas its far counterpart is shown in blue. The loops between the RBCC and PHD-Br domains have been omitted for visualization.
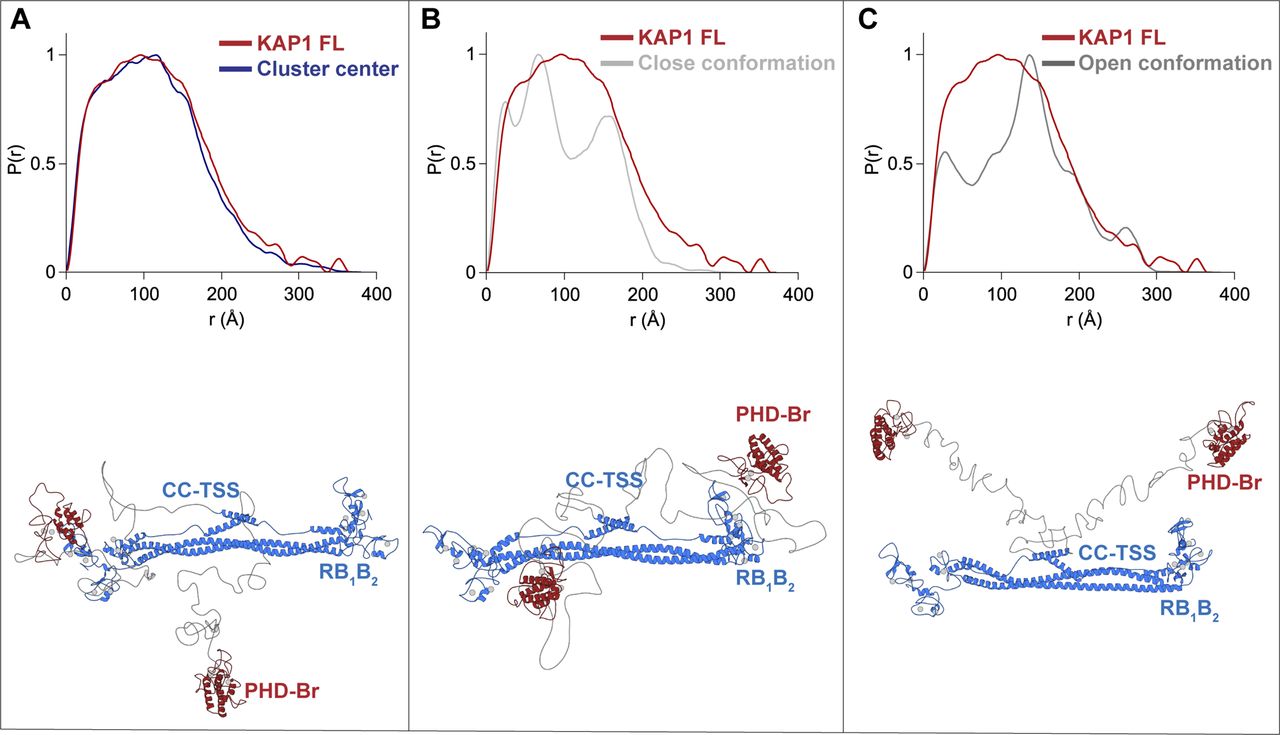
- Figure S8. Comparison of P(r) functions.
Superposition of experimental (red) and calculated (blue and grey) P(r) functions for models of KAP1 FL where the PHD-Br domains are in different positions. (A) PHD-Br domains as in the cluster center structure. (B) PHD-Br domains close to the RBCC domain. (C) PHD-Br domains both far away from the RBCC domain. The P(r) functions were calculated using ScÅtter (3).
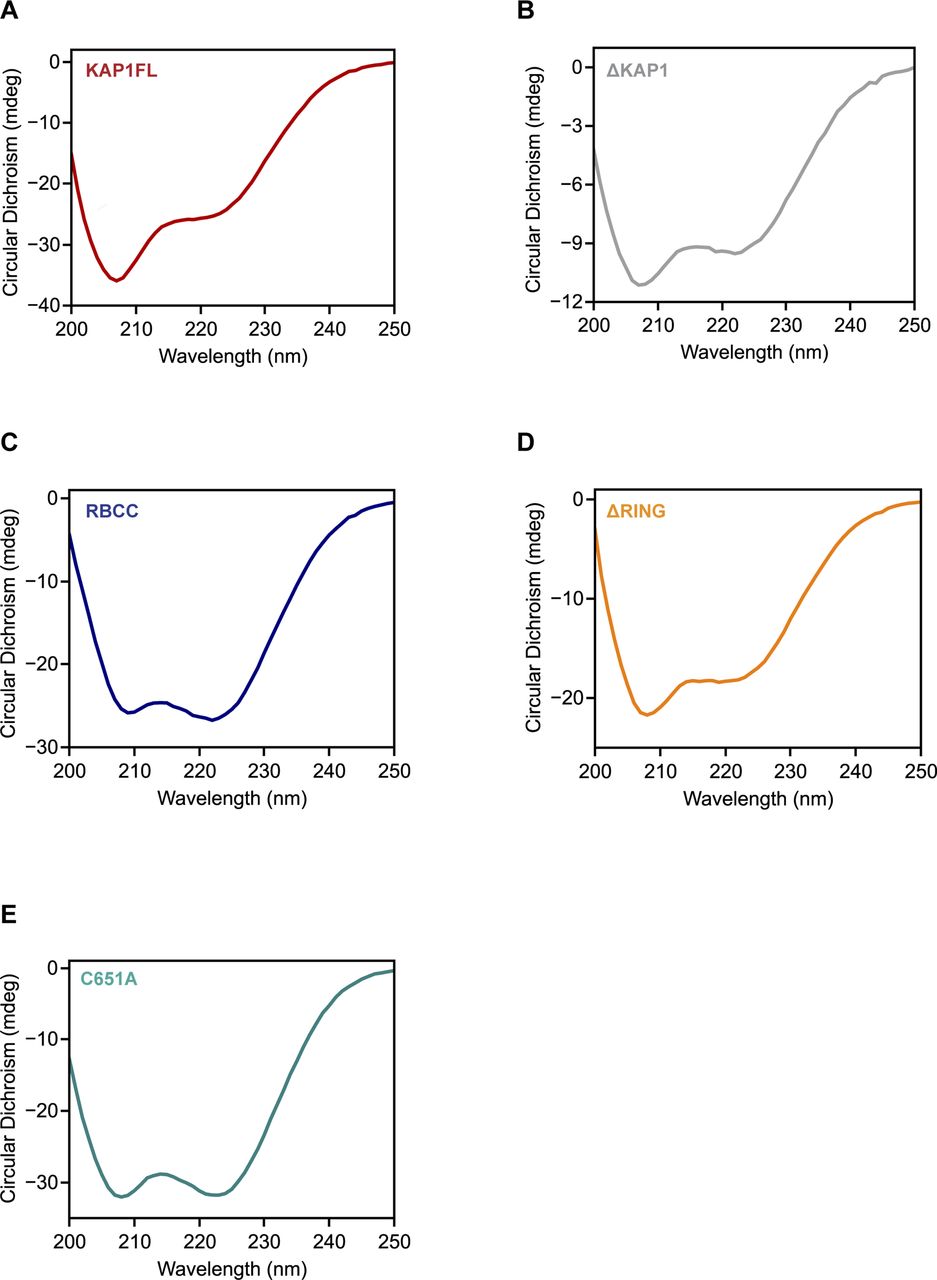
- Figure S9. Circular dichroism (CD) analysis of the KAP1 constructs used in this study shows that they are folded.
(A) CD spectrum of KAP1 FL. (B) CD spectrum of ΔKAP1. (C) CD spectrum of RBCC. (D) CD spectrum of ΔRING. (E) CD spectrum of C651A mutant. CD data were collected using a Chirascan CD Spectrometer and a 0.1 cm quartz cell. Sample concentration ranged from 0.2 to 0.8 mg/ml in phosphate buffer (1x PBS). Scans were measured from 200 to 250 nm, under continuous scanning mode with a 1-nm data pitch, a scan speed of 50 nm/min, and a response time of 1 s. The figure shows the average of three spectra, which are buffer-subtracted.
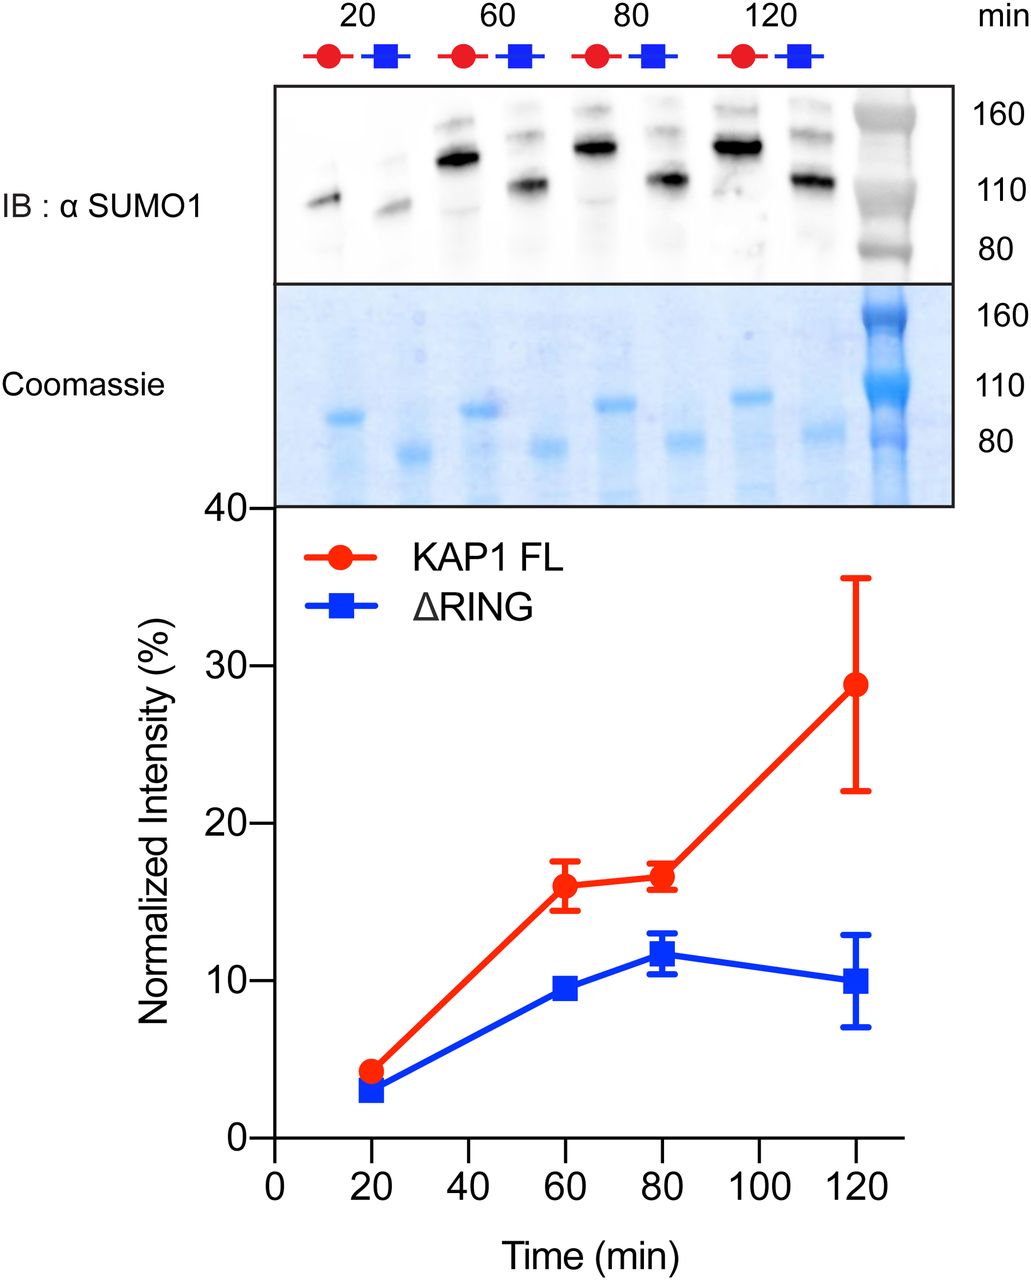
- Figure 4. The RING domain contributes to auto-SUMOylation of KAP1.
In vitro SUMOylation of KAP1, where reactions containing E1, E2 (Ubc9), SUMO1, and KAP1 variants (FL and ΔRING) were incubated for the time indicated (20 to 120 min). The samples were analyzed by Western blot with anti-SUMO1 antibody (top) and Coomassie blue staining (center). The intensity of the bands was quantified using ImageJ (74) and normalized with respect to the sum of all intensities. The graph shows the mean value and the standard error of the mean for each time step for the three technical replicas (uncropped images shown in Fig S10). Auto-SUMOylation for RBCC, C651A mutant, and controls are also reported in Fig S10.
- Figure S10. Uncropped Western blots related to Fig 4.
Panels (A), (B), and (C) show the experimental replicas for the auto-SUMOylation assay comparing KAP1 FL and ΔRING. The intensities were normalized with respect to the sum of all considered intensities. The Coomassie-stained SDS–PAGE is shown on the right as loading control. Panel (D) shows the auto-SUMOylation assay using the C651A mutant and KAP1 RBCC. As expected, KAP1 RBCC did not get SUMOylated. When comparing the MW shifts of the proteins upon SUMOylation, it is interesting to notice how when the PHD is active, the size change is large (50 kD, seen for FL and ΔRING), but when the PHD is compromised, the size change is very small (seen for the C651A mutant). On the right, the Coomassie-stained SDS–PAGE of the FL and C651A reactions are shown as loading control, where non-SUMOylated proteins are indicated by I FL and I C651A.
- Figure 5. KAP1 dimer binds only one HP1 dimer.
(A) ITC experiment titrating HP1α FL into KAP1 FL measures a tight interaction with a Kd of 176 nM and a molar ratio of 0.98. (B) SEC-MALS analysis comparison between KAP1 FL (red), HP1α FL (yellow), and complex (grey). (C) SEC-MALS analysis of the complex at different concentration ratios. The estimated masses for the complexes eluting at 11.8 ml when mixtures contained KAP1:HP1 ratios of 1:1, 1:5, and 1:10, were 233 kDa, 239 kDa, and 232 kDa, respectively. The second peak eluting at 16 ml is the excess HP1 dimer with a mass of 45 kDa. (D) Representative model of the interaction between a KAP1 FL dimer (blue and red) and an HP1 FL dimer (yellow). The CSD of HP1 has been placed as to bind the accessible HP1BD (insert). Further details about the modeling of the HP1 FL dimer are reported in Fig S11.
- Figure 6. KAP1 stabilizes HP1α–chromatin interactions.
(A) Schematic representation of the smTIRF imaging experimental setup, showing HP1α interacting with chromatin fibers in the presence of KAP1. bt, biotin; NA, NeutrAvidin. (B) Characteristic fluorescence time trace (grey) of HP1α (3 nM) binding dynamics to a single chromatin fiber, in the absence of KAP1. High-fluorescence emission reveals the time an HP1α molecule is bound (tbright), whereas low fluorescence emission indicates the absence of any bound molecules over a given time (tdark). The trace is fitted with a step function (yellow). Each intensity peak represents one binding event. (C) Fluorescence time trace of HP1α–chromatin binding dynamics, in the presence of 100 nM KAP1. The trace is fitted with a step function (red). (D) Dissociation kinetics: normalized, cumulative histograms of HP1α dwell times in the absence of KAP1 (yellow) or presence of 100 nM KAP1 (red). Both histograms are fitted with a double-exponential function. For fit values, see Table 1. (E) Association kinetics: normalized cumulative histogram of times between binding events for HP1α alone (yellow) or HP1α in the presence of 100 nM KAP1 (red), fitted with mono-exponential function. For fit values, see Table 1. (F, G) Dwell times τoff,1 (F) and τoff,2 (G), demonstrating that KAP1 stabilizes HP1α–chromatin interactions. Numbers indicate % amplitude. Error bars: SD, n = 3–10 replicates, *P < 0.05 (t test) versus 0 nM KAP1. For the fit values, see Table 1. (H) KAP1 reduces on-rates kon. Error bars: SD, n = 3–10 replicates, *P < 0.05 (t test) versus 0 nM KAP1. For the fit values, see Table 1. (I) A histogram of observed, normalized fluorescence peak intensities in kinetic traces reports on the oligomeric state of chromatin bound HP1α (yellow). This demonstrates that HP1α exists mostly as monomers at 3 nM concentration. Considering the observed labeling efficiency of 60%, the 8% of all observations correspond to dimers. (J) At 100 nM, KAP1 stabilizes HP1α dimers (28%) (red).
- Figure S11. Analysis of the conformation of HP1 FL using SAXS.
(A) SAXS scattering profile. (B) Pair distance distribution function, P(r). The insert shows the resulting Rg and Dmax values. (C) The HP1α FL model was built using PDB files 1S4Z for the CSD and 1Q3L for the CD and letting EOM (ensemble optimization method) (4) build the flexible linker to create ensembles of conformations of the dimer. EOM ensembles contained only two structures: a closed one (left) and an open one (right). (D) Closed HP1α model superimposed in the ab initio shape created directly from the SAXS data using GASBOR.


Tables
KAP1 (nM) τoff,1 (s) % A1 τoff,2 (s) % A2 kon (M−1s−1) × 106 n 0a 0.25 ± 0.03 87 ± 7 2.26 ± 1.22 13 ± 7 3.64 ± 1.56 10 50 0.29 ± 0.05 89 ± 3 3.64 ± 0.47 11 ± 3 1.03 ± 0.37 4 100 0.28 ± 0.02 85 ± 3 5.79 ± 1.03 15 ± 3 1.42 ± 0.95 4 200 0.27 ± 0.04 87 ± 2 5.47 ± 0.93 13 ± 2 1.43 ± 0.45 3 400 0.23 ± 0.02 86 ± 11 5.03 ± 0.65 14 ± 11 0.77 ± 0.44 3 Fit results from smTIRF measurements of HP1α in the presence of the indicated concentrations of KAP1. N denotes the number of independent experiments, each contributing >100 kinetic traces.
↵a Values taken from reference (76).
Table S1 SAXS parameters.


In this Issue
Related Articles
Cited By...
- No citing articles found.