


Article Figures & Data
Figures
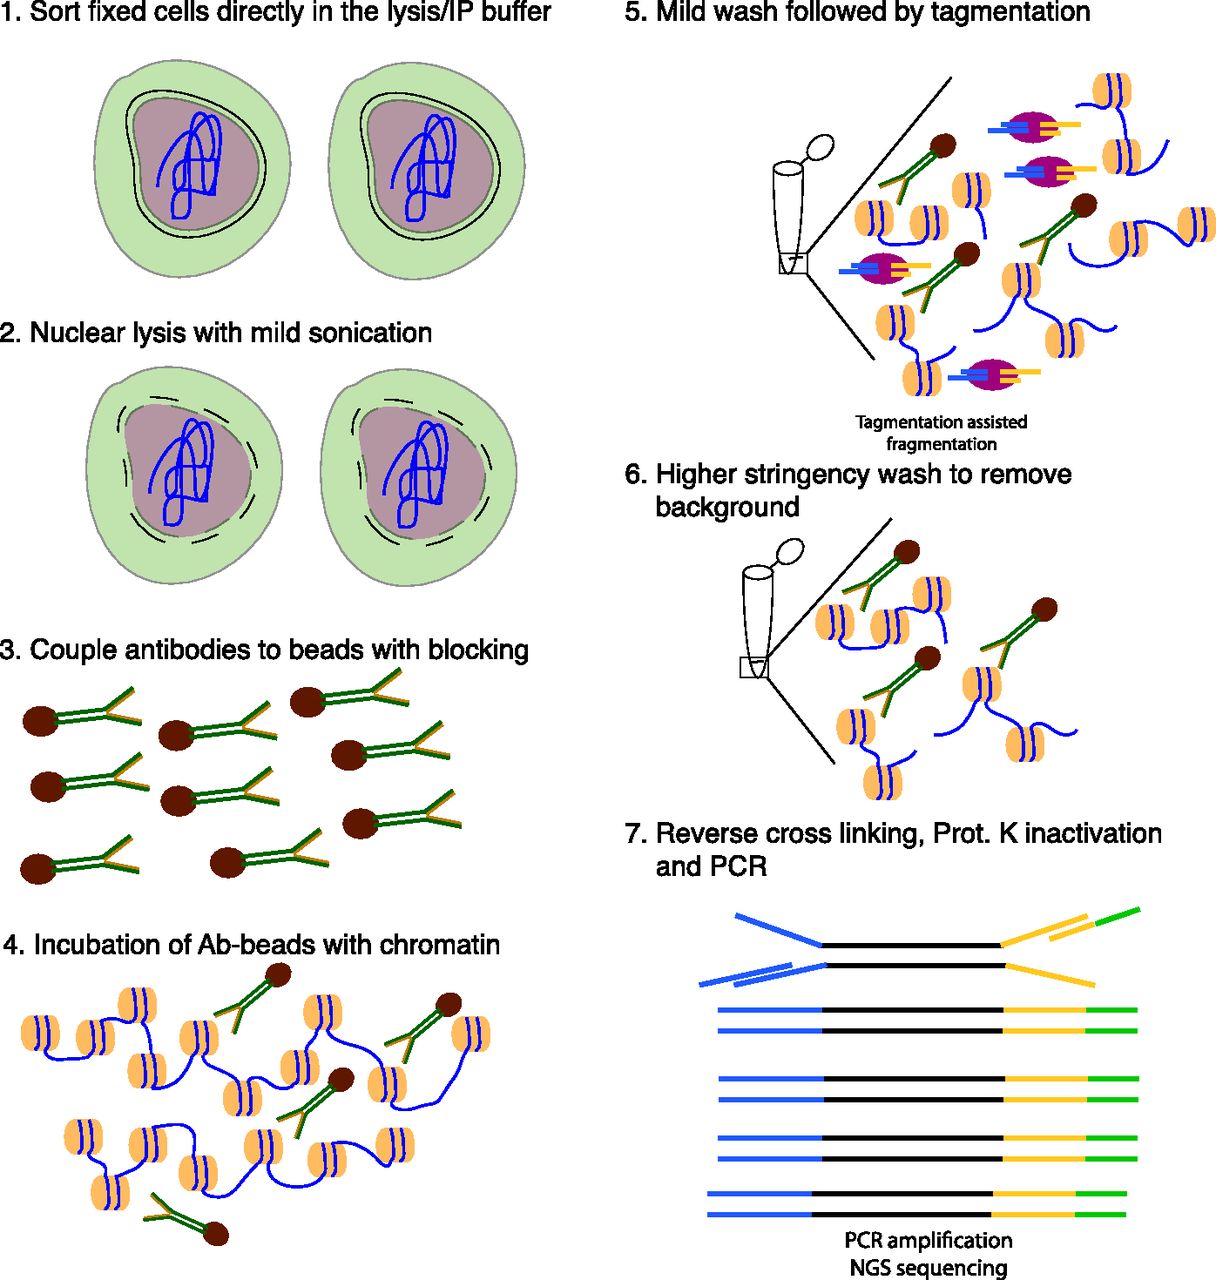
- Figure 1. Schematic overview of TAF-ChIP approach.
(1) Formaldehyde fixed cells were directly sorted into radio immunoprecipitation (RIPA) buffer (see the Materials and Methods section for details). (2) The cells were briefly sonicated at low intensity to break open the nuclei. (3) Antibodies were coupled to magnetic beads in the presence of blocking reagents. (4) Antibody-coupled beads were added to the cell lysate and incubated overnight at 4°C. (5) The tagmentation reaction was performed after initial washes with low salt IP buffer and homemade tagmentation buffer. (6) The tagmentation reaction and the background regions (not anchored by antibody interaction) were washed away with subsequent high-stringency washes. (7) The proteinase K was heat-inactivated and the material was PCR-amplified without purification.
- Figure S1. Comparison of TAF-ChIP with ENCODE, conventional ChIP-Seq, and CUT&RUN.
(A) Bioanalyzer profile before and after tagmentation with indicated cell numbers. The amount of Tn5 tagmentase was kept constant in all conditions. (B) Bioanalyzer profile of a representative TAF-ChIP library showing the size distribution of final library fragments. (C) Genome browser track example of H3K27Me3 with TAF-ChIP approach and recently published CUT&RUN method with different cell numbers, as indicated in the labels. The label below the tracks shows the gene model, and the y-axis represents normalized read density in reads per million. (D) Clusterogram of TAF-ChIP H3K9Me3 (highlighted with a rectangular box) and indicated datasets derived from the signal in the peak file. H3K4Me3 and H3K36Me3 were included as controls. Note that the TAF-ChIP replicates for H3K9Me3 cluster together with the equivalent datasets from ENCODE. The legend in the left indicates the distance based on Jaccard index. (E) Clusterogram of TAF-ChIP H3K27Me3 datasets (highlighted by a rectangular box) with equivalent datasets from ENCODE, CUT&RUN datasets (from 100, 3,000, and 6,000 cells), and nonrelated histone modification datasets used as control. (F) Clusterogram of TAF-ChIP H3K9Me3 datasets (highlighted by a rectangular box) with conventional ChIP-Seq dataset from Drosophila NSCs.
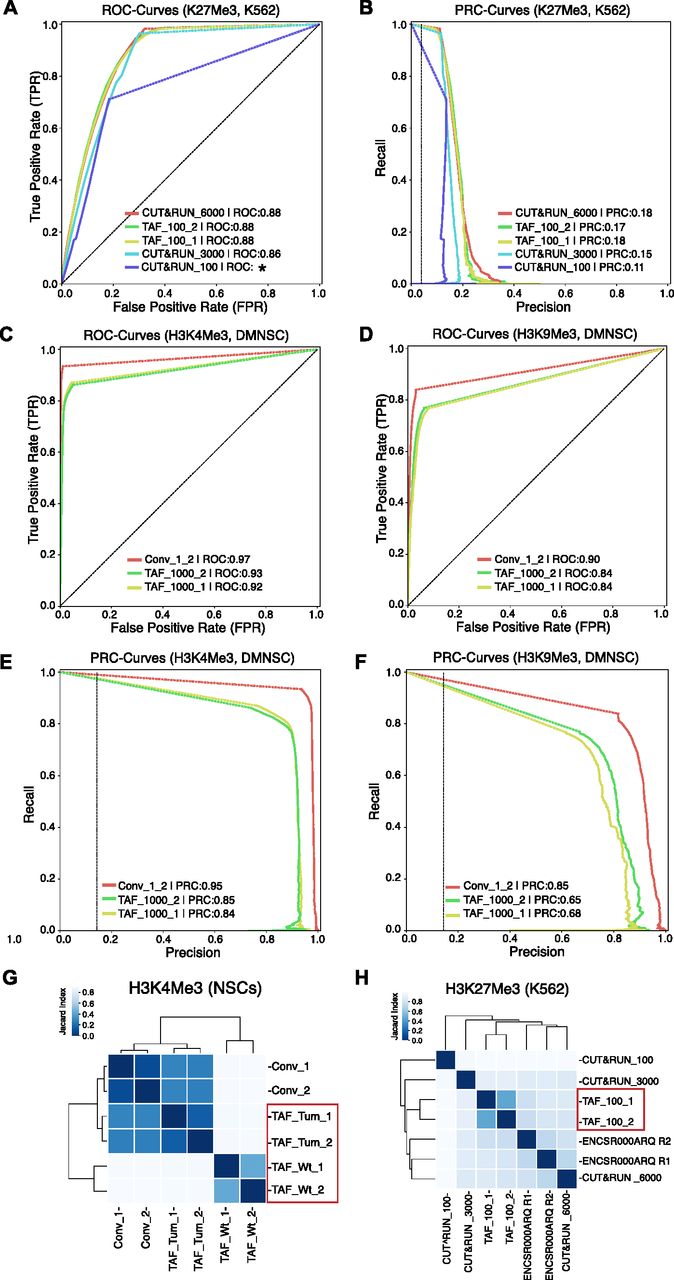
- Figure 2. Comparison of TAF-ChIP with conventional ChIP-Seq and with the CUT&RUN low amount method.
(A) ROC curves of TAF-ChIP and CUT&RUN for H3K27Me3 in K562 cells. The ROC curves were plotted using as reference replicated peaks of the conventional ChIP-Seq ENCODE dataset selected at 5% FDR cutoff (downloaded from the ENCODE database). No FDR cutoff was used to define peaks for TAF-ChIP replicates and the CUT&RUN datasets with MACS2. Peaks were mapped to 5 kb non-overlapping genomic windows to calculate true-positive rate or recall, false-positive rate and precision for a changing P-Value threshold. Area under the curve (AUC) is indicated in the legend in decreasing order, and the * indicates the failure to faithfully calculate the AUC. (B) Precision-recall curve for TAF-ChIP and CUT&RUN datasets for H3K27Me3 in K562 cells. (C, D) ROC curves of TAF-ChIP and conventional ChIP-Seq in Drosophila NSCs. The ROC curves for H3K4Me3 (C) and H3K9me3 (D) were plotted using as reference peaks of the first conventional ChIP-Seq replicate selected at 5% FDR cutoff. No FDR cutoff was used to define peaks for TAF-ChIP replicates and the second conventional ChIP-Seq replicate. Peaks were mapped to 1 kb non-overlapping genomic windows to calculate true-positive rate or recall, false-positive rate, and precision. AUC is indicated in the legend in decreasing order. (E, F) Precision-recall curve for TAF-ChIP and conventional ChIP-Seq in Drosophila NSCs. Using same references and data as above, precision-recall curves were plotted for H3K4Me3 (E) and H3k9Me3 (F). (G) Comparison of the genomic window sets for Drosophila brain-derived wt NSCs analyzed for H3K4Me3 binding by TAF-ChIP (TAF_Wt), and Drosophila tumor-derived NSCs analyzed by TAF-ChIP or conventional ChIP-Seq (TAF_Tum and Conv). The TAF-ChIP samples are highlighted by a red rectangular box. The heat map indicates pairwise similarity according to the Jaccard index. Axes show results of hierarchical clustering. (H) The Jaccard index and hierarchical clustering, as described in (G), to compare H3K27Me3 binding in K562 cells. The comparison was performed for 100 cells TAF-ChIP samples (highlighted with a red rectangular box), to CUT&RUN method with 100, 3,000, and 6,000-cell samples, and to conventional ChIP-Seq (ENCODE) (12, 19).
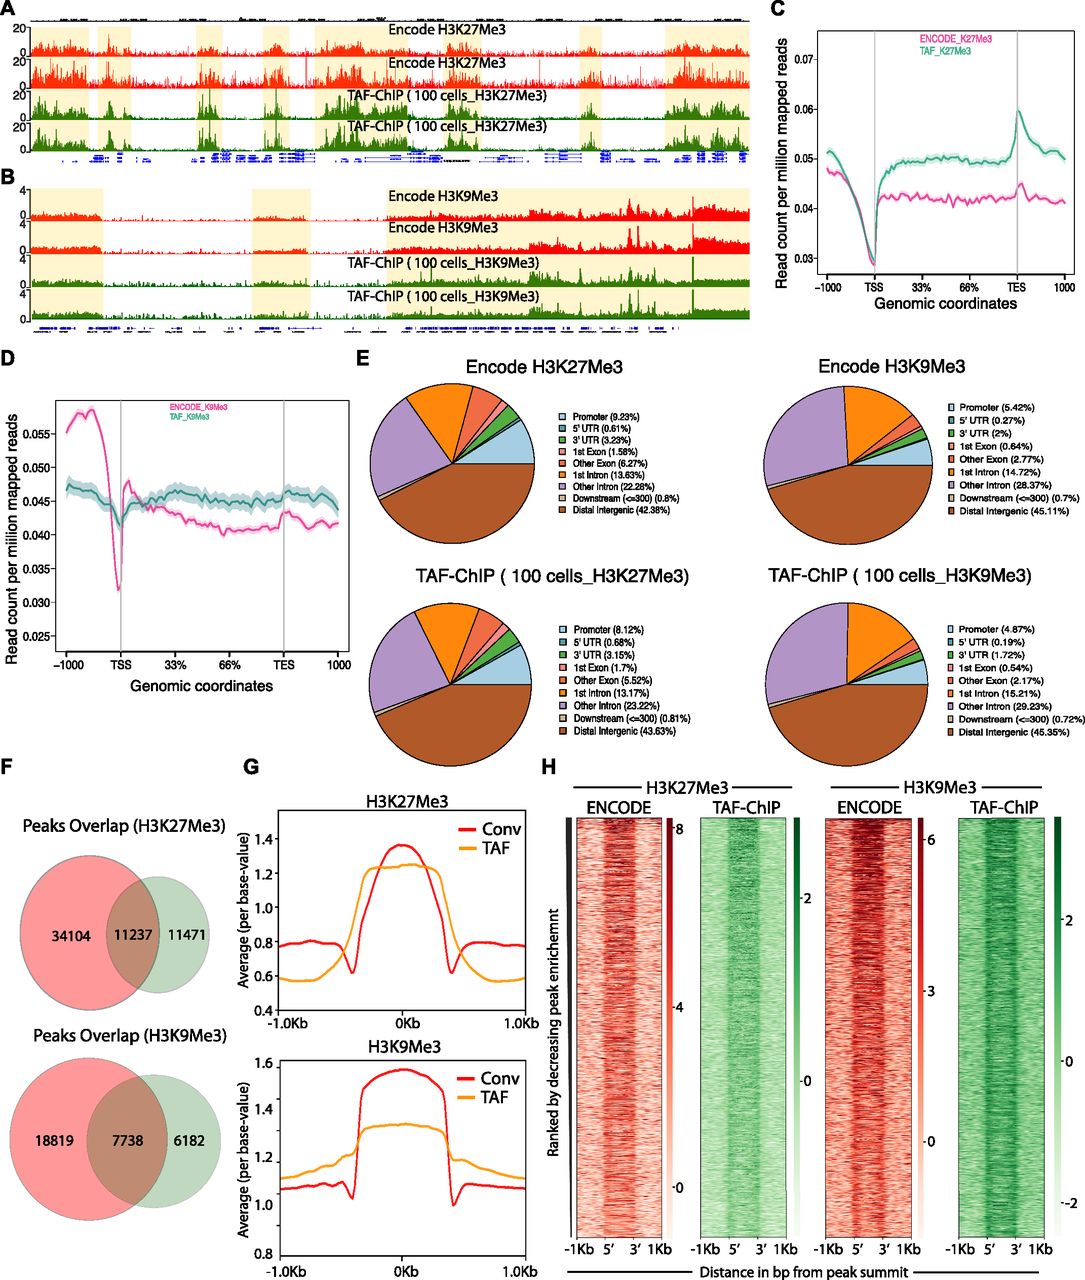
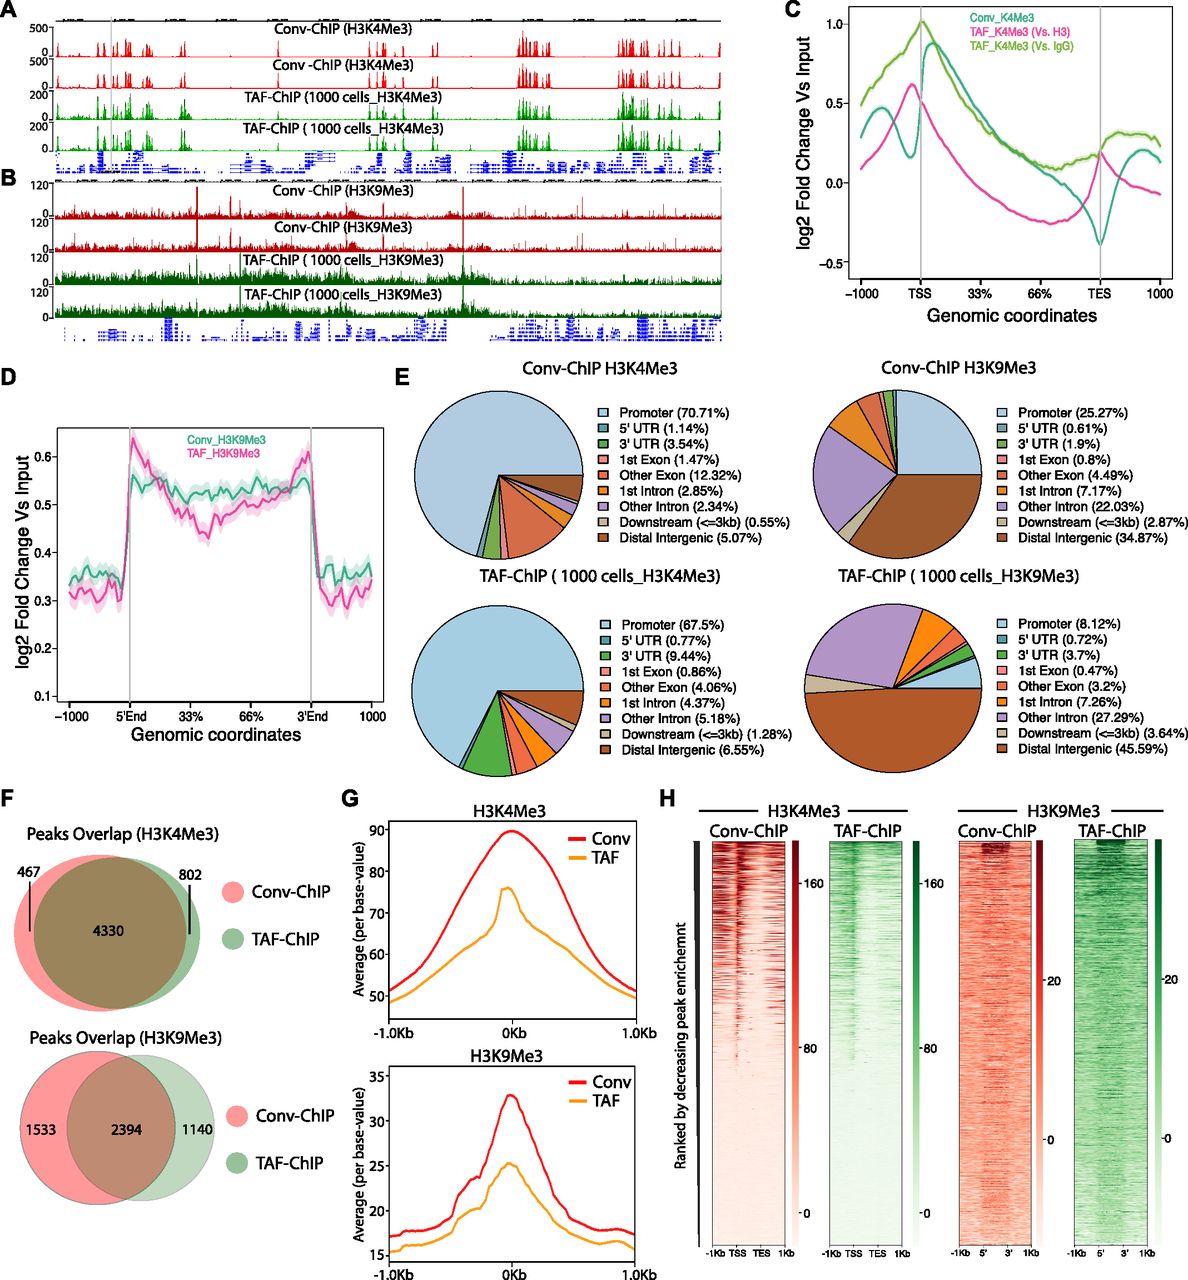
- Figure 3. TAF-ChIP results from 100 K562 cells are comparable with conventional Encode ChIP-Seq datasets.
(A, B) Genome browser track example of H3K27Me3 and H3K9Me3 (A and B, respectively) ChIP performed in 100 FACS sorted K562 cells with TAF-ChIP approach and corresponding K562 conventional ChIP-Seq datasets from the ENCODE project in duplicates, as indicated in the labels. The label below the tracks shows the gene model and the y-axis represents normalized read density in reads per million. The enriched regions are highlighted with shaded box. (C, D) Metagene profiles of H3K27Me3 and H3K9Me3 (C and D, respectively) with standard error to the mean for all the genes, −1,000 bp upstream of TSS and +1,000 bp downstream of transcription end sites (TES). Read counts per million of mapped reads is shown on the y-axis, whereas the x-axis depicts genomic coordinates. (E) Genomic distribution of annotated peaks obtained from the ENCODE datasets and TAF-ChIP (100 K562 cells), for indicated histone marks. Note the majority of H3K27Me3 and H3K9Me3 peaks are at the intergenic regions, consistent with the expectation. (F) Overlap between the peaks identified from the ENCODE and TAF-ChIP datasets, for the indicated histone modifications (see the Materials and Methods section for further details). (G) Average profile of TAF-ChIP and corresponding ENCODE ChIP-Seq centered at the peaks for the indicated histone modifications. The y-axis depicts average per base value into the peaks, whereas x-axis depicts genomic coordinates centered at the peaks. (H) Distributions of reads at gene locations of indicated histone modifications from ENCODE ChIP-Seq and TAF-ChIP method, centered at the peaks (−1 kb to +1 kb). Rows indicate all the peaks and are sorted by decreasing affinities in the ENCODE ChIP-Seq datasets. The color labels to the right indicate the level of enrichment.
- Figure S2. TAF-ChIP libraries evaluated in terms of replicate variability and peaks recovery, from 100 K562 cells.
(A, B) Pearson correlation between the indicated replicates of TAF-ChIP samples from 100 K562 cells, across equal sized bins of 2000 bp. (C, D) Percentage recovery of peaks in TAF-ChIP dataset compared with a corresponding ENCODE ChIP-Seq dataset. The quantiles were sorted according to increasing FDR (provided by MACS2). Recovery of peaks of one of the replicates of the ENCODE ChIP-Seq dataset when the other is used as reference is shown for comparison. For H3K27Me3 (C) and H3K9Me3 (D), histone modifications in K562 cells.
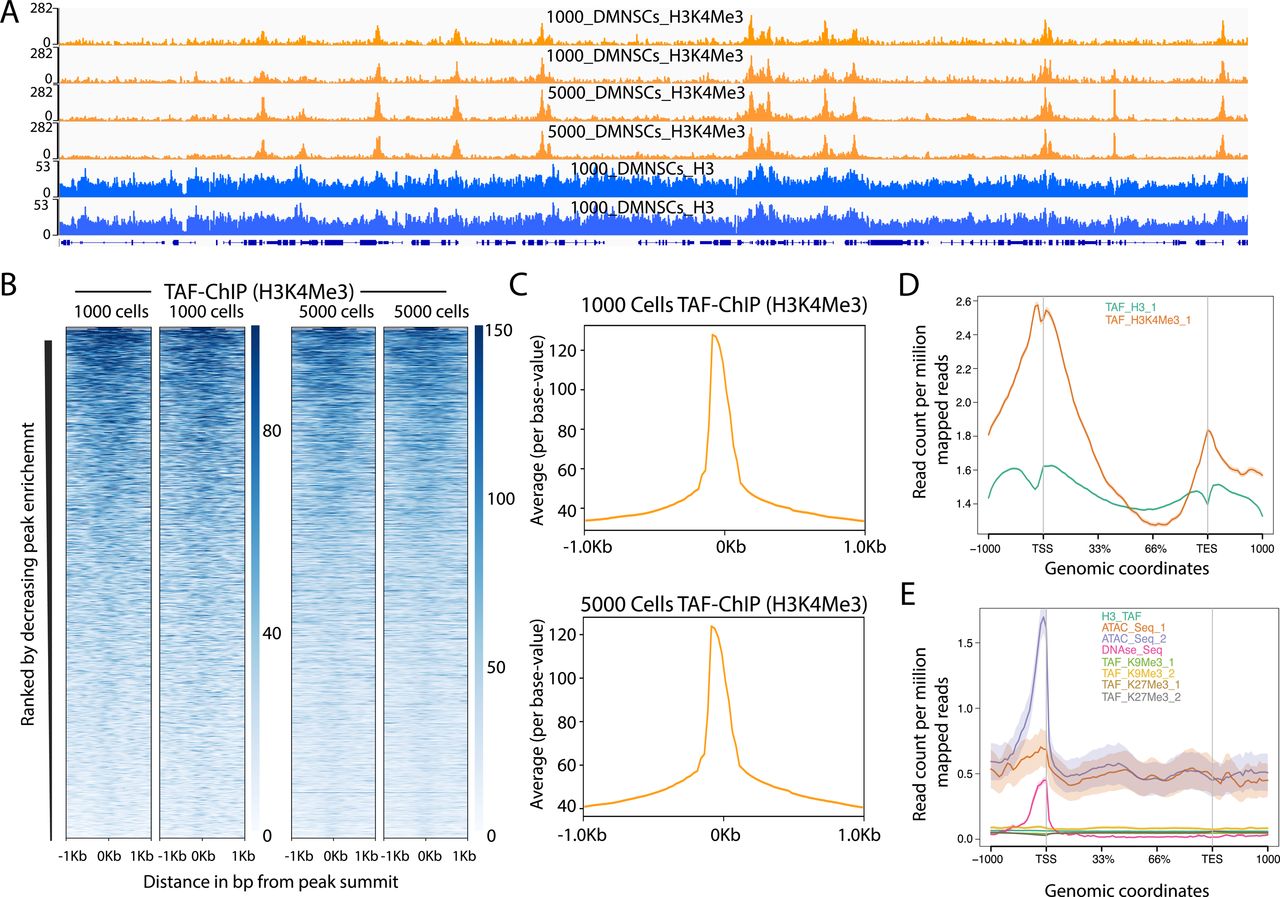
- Figure 4. TAF-ChIP results from low number of NSCs are comparable with conventional ChIP-Seq (Conv-ChIP).
(A, B) Genome browser track example of H3K4Me3 and H3K9Me3 ChIP (panel A and B, respectively) performed in FACS-sorted NSCs with conventional ChIP-Seq (1.2 million cells) and TAF-ChIP (1,000 cells), as indicated by the labels. The label below the tracks shows the gene model and the y-axis represents normalized read density in reads per million (rpm). (C) Metagene profiles of H3K4Me3 with standard error to the mean for all genes, −1,000 bp upstream of TSS and +1,000 bp downstream of transcription end sites (TESs). Log2-fold changes against input controls are shown on the y-axis, whereas the x-axis depicts genomic coordinates. (D) Metagene profiles of H3K9Me3 with standard error to the mean for enriched regions, −1,000 bp upstream and +1,000 bp downstream of peaks. Log2-fold changes against input control are shown on the y-axis, whereas the x-axis depicts genomic coordinates. (E) Distribution of annotated peaks obtained from conventional ChIP-Seq and TAF-ChIP, for indicated histone marks. Note that most H3K4Me3 and H3K9Me3 peaks are at the promoters and at the intergenic regions, respectively, consistent with the expectation. (F) Overlap between the peaks identified from conventional ChIP-Seq and TAF-ChIP datasets, for the indicated histone modifications. MACS2 software with identical parameters (see the Materials and Methods section for details) was used to identify the peaks against the respective input controls, and those present in both replicates were considered for the comparison. (G) Average profile of TAF-ChIP and conventional ChIP-Seq centered at the peaks for the indicated histone modifications. The y-axis depicts average per base value into the peaks, whereas the x-axis depicts genomic coordinates centered at the peaks. (H) Distributions of reads at gene locations of indicated histone modifications from conventional ChIP-Seq and TAF-ChIP. Rows indicate all the peaks and are sorted by decreasing affinities in the conventional ChIP-Seq datasets. The color labels to the right indicate the level of enrichment.
- Figure S3. TAF-ChIP libraries evaluated in terms of replicate variability and peaks recovery, from 1,000 Drosophila NSCs.
(A) Table showing the percentage of mapped reads from TAF-ChIP experiments. The read duplicates were quantified using Picard Tools. (B, C) Pearson correlation between the indicated replicates of TAF-ChIP samples from Drosophila 1,000 cells, across equal-sized bins of 500 bp. (D) ChIP-qPCR analysis of enrichment at the tested loci in TAF-ChIP and conventional approach against respective input controls, fragmented DNA in conventional and H3 for TAF. The tested loci Mapk, Dab, Rca1, and Dock showed enrichment in conventional and TAF-ChIP-Seq results, whereas Mapk distal did not show any enrichment in either approach. (E, F) Percentage recovery of peaks in TAF-ChIP datasets compared with conventional ChIP-Seq datasets. The quantiles were sorted according to increasing FDR (provided by MACS2). Recovery of peaks of one of the replicates of conventional ChIP-Seq using the other as reference is shown for comparison. For H3K4Me3 (E) and H3K9Me3 (F), histone modifications in Drosophila NSCs. (G, H) Fraction of peaks recovered for H3K4Me3 (G) and H3K9Me3 (H) TAF-ChIP samples from Drosophila, at various sequencing depths.
- Figure S4. TAF-ChIP results from different amounts of starting material are identical and H3 TAF-ChIP do not show any visible biases for open chromatin.
(A) Genome browser track example of H3K4Me3 ChIP performed for two replicates in 1,000 and 5,000 FACS-sorted Drosophila NSCs along with H3 controls, as indicated in the labels. The label below the tracks shows the gene model, and the y-axis represents normalized read density in reads per million (rpm). (B) Heat maps of TAF-ChIP datasets for H3K4Me3 from 1,000 and 5,000 sorted Drosophila NSCs. Rows indicate all the peaks and are sorted by decreasing affinities in the conventional ChIP-Seq datasets. The color labels to the right indicate the level of enrichment. (C) Average profile of TAF-ChIP data from 1,000 and 5,000 NSCs, centered at the peaks for the H3K4Me3 modification. The y-axis depicts average per base peak signal, whereas the x-axis depicts genomic coordinates centered at the peaks. (D) Metagene profiles of H3 and H3K4Me3 from 1,000 Drosophila NSCs with standard error to the mean for all genes, −1,000 bp upstream of transcription start sites and +1,000 bp downstream of transcription end sites (TESs). Read counts per million of mapped reads is shown on the y-axis, whereas the x-axis depicts genomic coordinates. (E) Metagene profiles of indicated datasets with standard error to the mean for all genes in K562 cells, −1,000 bp upstream of TSSs and +1,000 bp downstream of TESs. Read counts per million of mapped reads is shown on the y-axis, whereas the x-axis depicts genomic coordinates. The ATAC-Seq and DNAse-Seq datasets are derived from PMID: 26280331.
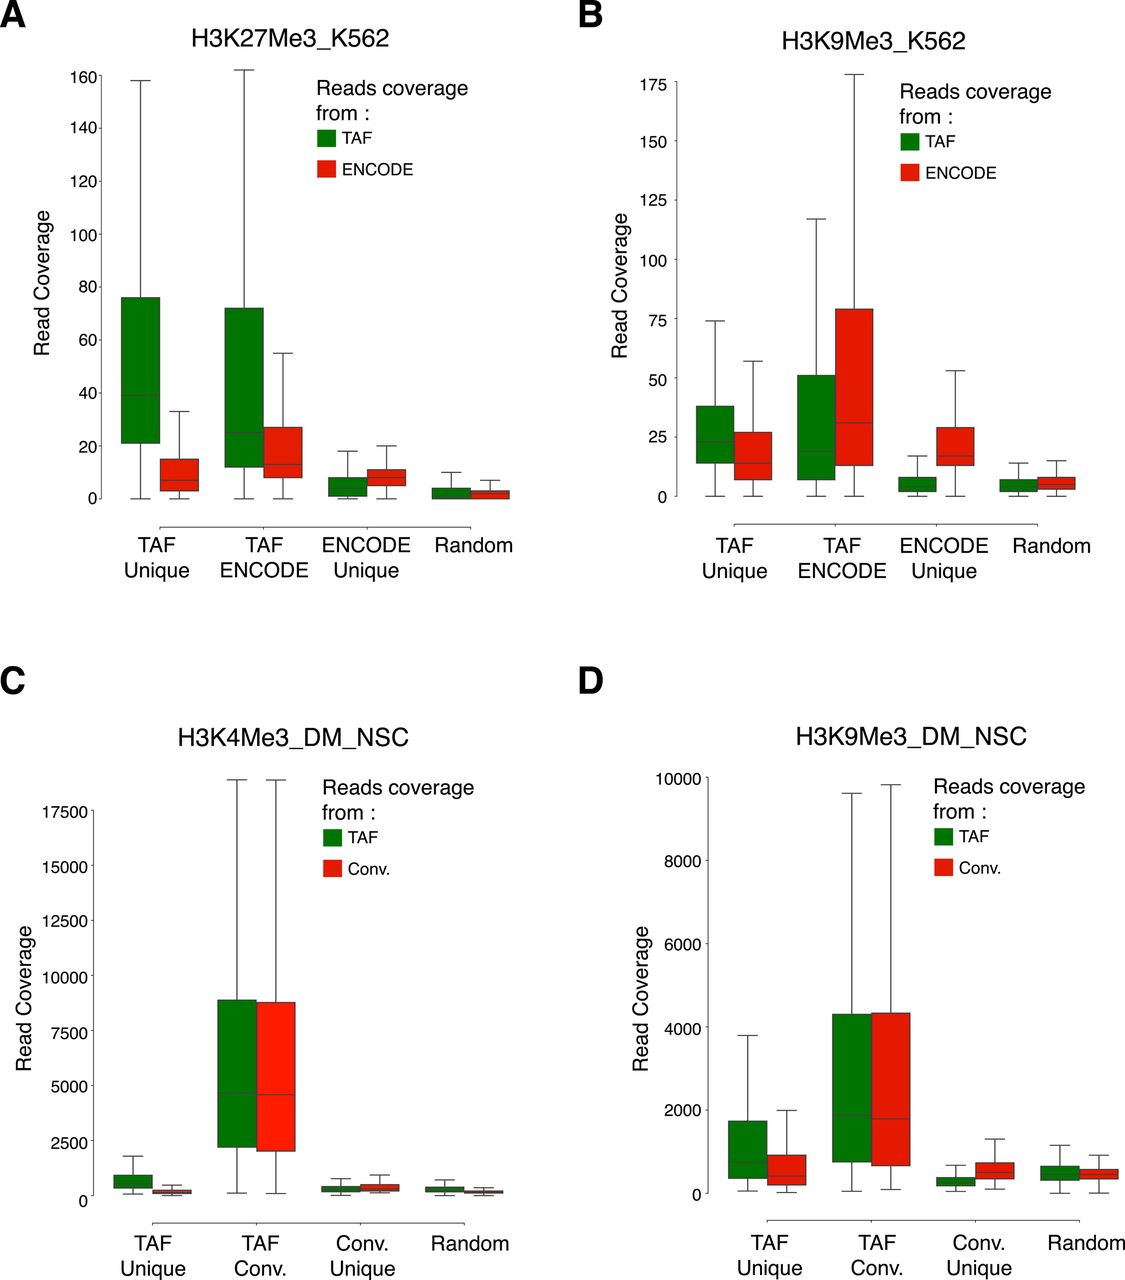
- Figure S5. Coverage of reads over the overlapping and unique peaks identified in the TAF-ChIP and conventional datasets.
(A–D) Boxplots showing coverage of raw reads over the peaks identified either uniquely in TAF (TAF Unique) or conventional ChIP-Seq approach (ENCODE Unique or Conv. Unique), or common to both of the approaches (TAF ENCODE or TAF Conv.). Shown also is the coverage of reads over randomly selected regions of comparable size (Random). From K562 cells for H3K27Me3 (A) and H3K9Me3 (B), and from Drosophila NSCs for H3K4Me3 (C) and H3K9Me3 (D).


Tables
Mapk distal Fwd ATCGGGACCTTAAGCCAAGT Mapk distal Rev AAACGCTTTTACTGCTGATGG Dock Fwd GCTCCGGCAAAATCATTAAA Dock Rev CGCGATTGAAAAACACACAA Dab Fwd CCCCACAACGCCTTAAAGTA Dab Rev TTTGCGTCTTCCGTCTCTTT Rca1 Fwd GGTCACACTGATCCGTACCC Rca1 Rev CTCCAACTCGAAGGATGACC Primer-Neg Fwd CCATTAATCGAGGGCTGAAA Primer-Neg Rev TTGGGGCATAAACAGAGGAC fw ATAC-seq primer, general, no index AATGATACGGCGACCACCGAGATCTACACTCGTCGGCAGCGTCAGATGT*G rev ATAC-seq primer, Truseq, index 34 CATGGC CAAGCAGAAGACGGCATACGAGATGCCATGGTCTCGTGGGCTCGGAGATG*T rev ATAC-seq primer, Truseq index, 48 TCGGCA CAAGCAGAAGACGGCATACGAGATTGCCGAGTCTCGTGGGCTCGGAGATG*T rev ATAC-seq primer, Truseq index, 22 CGTACG CAAGCAGAAGACGGCATACGAGATCGTACGGTCTCGTGGGCTCGGAGATG*T rev ATAC-seq primer, Truseq index, 15 ATGTCA CAAGCAGAAGACGGCATACGAGATTGACATGTCTCGTGGGCTCGGAGATG*T rev ATAC-seq primer, Truseq index, 46 TCCCGA CAAGCAGAAGACGGCATACGAGATTCGGGAGTCTCGTGGGCTCGGAGATG*T rev ATAC-seq primer, Truseq index, 45 TCATTC CAAGCAGAAGACGGCATACGAGATGAATGAGTCTCGTGGGCTCGGAGATG*T rev ATAC-seq primer, Truseq index, 40 CTCAGA CAAGCAGAAGACGGCATACGAGATTCTGAGGTCTCGTGGGCTCGGAGATG*T rev ATAC-seq primer, Truseq index, 39 CTATAC CAAGCAGAAGACGGCATACGAGATGTATAGGTCTCGTGGGCTCGGAGATG*T rev ATAC-seq primer, Truseq index, 38 CTAGCT CAAGCAGAAGACGGCATACGAGATAGCTAGGTCTCGTGGGCTCGGAGATG*T rev ATAC-seq primer, Truseq index, 37 CGGAAT CAAGCAGAAGACGGCATACGAGATATTCCGGTCTCGTGGGCTCGGAGATG*T rev ATAC-seq primer, Truseq index, 36 CCAACA CAAGCAGAAGACGGCATACGAGATTGTTGGGTCTCGTGGGCTCGGAGATG*T rev ATAC-seq primer, Truseq index, 35 CATTTT CAAGCAGAAGACGGCATACGAGATAAAATGGTCTCGTGGGCTCGGAGATG*T rev ATAC-seq primer, Truseq index, 25 ACTGAT CAAGCAGAAGACGGCATACGAGATATCAGTGTCTCGTGGGCTCGGAGATG*T rev ATAC-seq primer, Truseq index, 26 ATGAGC CAAGCAGAAGACGGCATACGAGATGCTCATGTCTCGTGGGCTCGGAGATG*T rev ATAC-seq primer, Truseq index, 27 ATTCCT CAAGCAGAAGACGGCATACGAGATAGGAATGTCTCGTGGGCTCGGAGATG*T rev ATAC-seq primer, Truseq index, 28 CAAAAG CAAGCAGAAGACGGCATACGAGATCTTTTGGTCTCGTGGGCTCGGAGATG*T rev ATAC-seq primer, Truseq index, 23 GAGTGG CAAGCAGAAGACGGCATACGAGATCCACTCGTCTCGTGGGCTCGGAGATG*T rev ATAC-seq primer, Truseq index, 24 GGTAGC CAAGCAGAAGACGGCATACGAGATGCTACCGTCTCGTGGGCTCGGAGATG*T rev ATAC-seq primer, Truseq index, 42 TAATCG CAAGCAGAAGACGGCATACGAGATCGATTAGTCTCGTGGGCTCGGAGATG*T rev ATAC-seq primer, Truseq index, 41 GACGAC CAAGCAGAAGACGGCATACGAGATGTCGTCGTCTCGTGGGCTCGGAGATG*T
Supplemental Data S1.
Supplemental Data S2.


