


Article Figures & Data
Figures
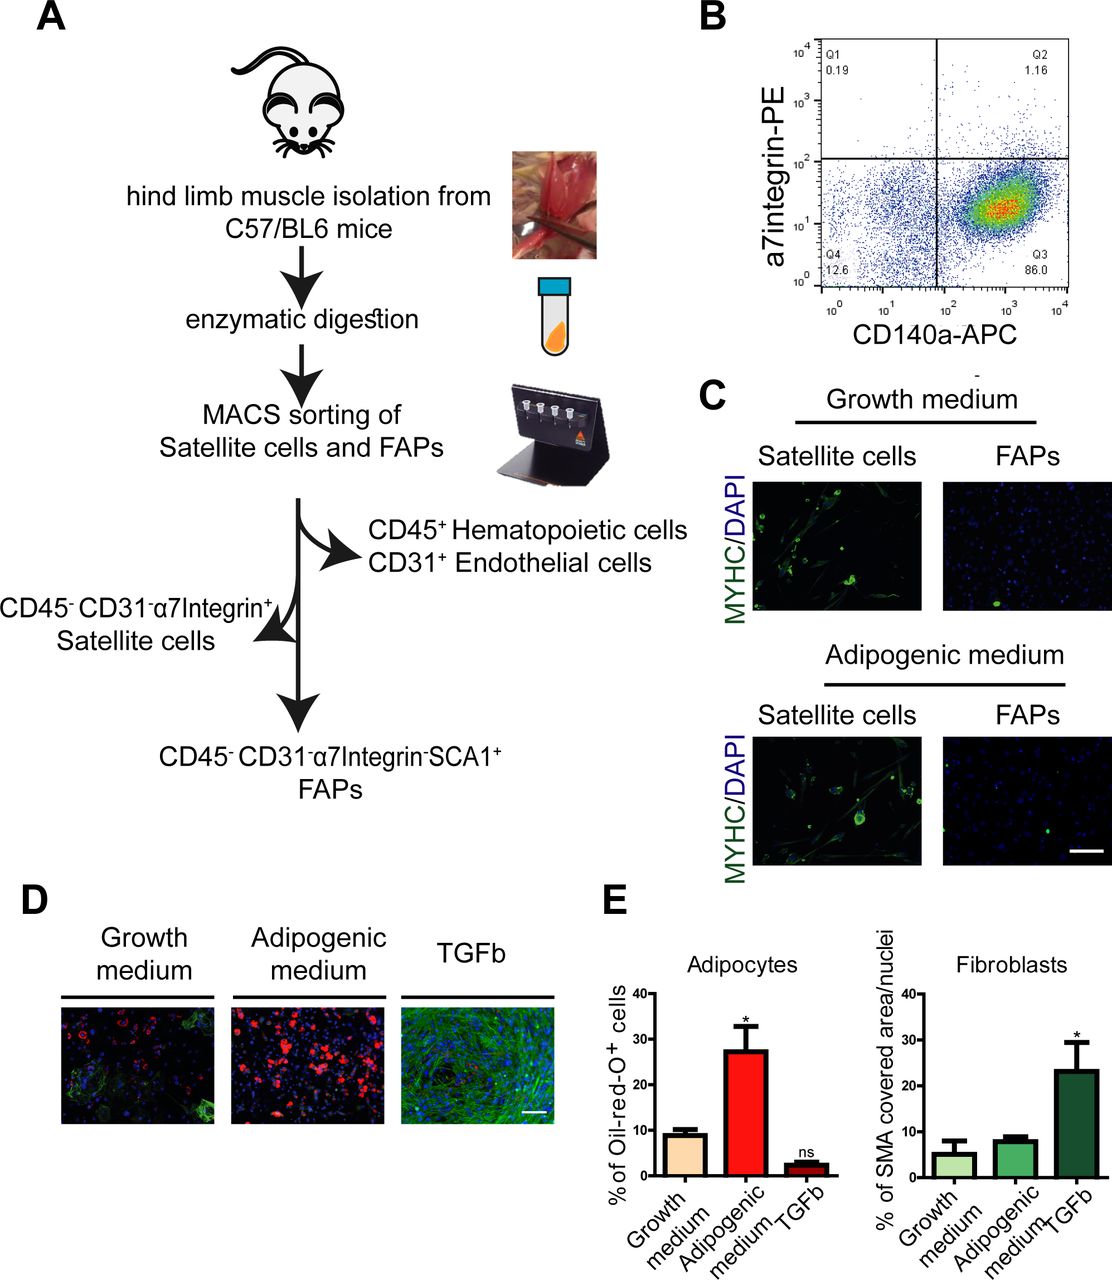
- Figure S1. related to Fig 1. Isolation and characterization of FAPs.
(A) Schematic representation of cell isolation strategy. (B) Flow cytometry analysis of FAPs plated in growth medium (DMEM + 20% FBS) for 4 d and stained with antibodies raised against CD140a and α7-integrin. (C) CD31−/CD45−/a7-integrin−/SCA1+ cells were cultivated in growth and adipogenic media for 8 d and stained with antibodies against the MYHC and with DAPI. Scale bar: 100 μm. (D) Differentiation potential of CD31−/CD45−/a7-integrin−/SCA1 cells. Cells were cultivated for 8 d to differentiate spontaneously in growth medium or were induced to differentiate into adipocytes (adipogenic medium) or into fibroblasts (growth medium supplemented with 10 ng/ml TGFb). Adipocytes were identified with ORO stain, and fibroblasts were stained with fluorescent antibodies against smooth muscle actin (SMA). Nuclei were counterstained with DAPI. Scale bar: 100 μm. (E) Percentage of adipocytes and SMA covered area are presented on graphs. Quantification of the immunofluorescence images are presented as average ± SEM of three biological replicas (n = 3). Statistical significance was evaluated by the ANOVA test (*P < 0.05).
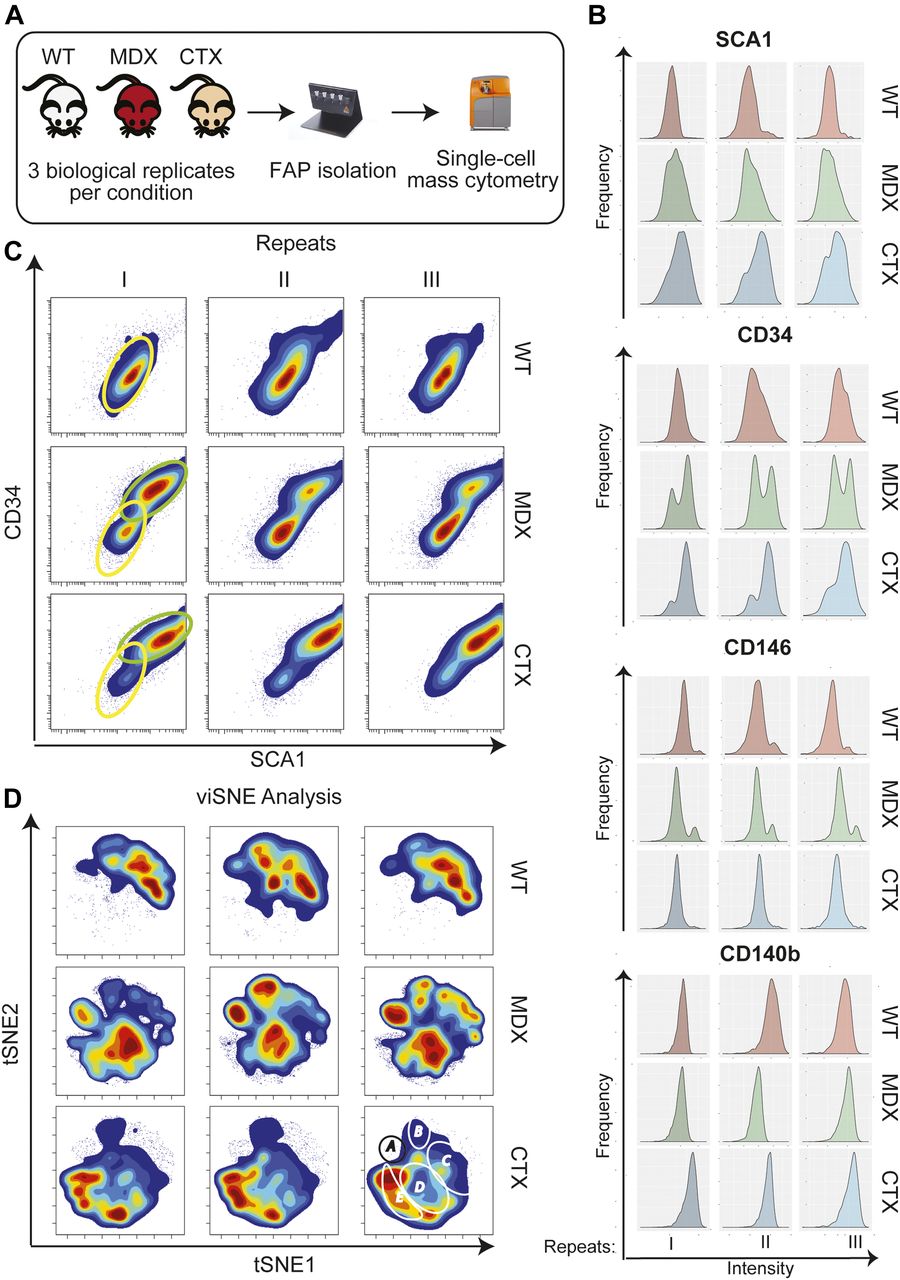
- Figure 1. Mass cytometry analysis of wt, mdx, and ctx FAPs.
FAPs were purified using MACS microbead technology from hind limb muscles of 6-wk-old wt, mdx, and ctx (3 dpostinjury) mice. The different cell samples were bar coded by labeling with different proportions of three palladium isotopes. The bar coded cell samples were pooled and incubated with 12 metal-labeled antibodies (SCA1, CD34, CD146, CD140b, CD31, CXCR4, CAS3, Vim, pSTAT1, TNFa, pCREB and pSTAT3) and analyzed by mass cytometry in a Cytof2 instrument. (A) Schematic representation of the experimental design. (B) Intensity distribution of the signals of four different antigens (SCA1, CD34, CD146 and CD140b). (C) Contour maps of the scatter plots showing the correlations between SCA1 and CD34 expression in the three biological repeats for the three conditions. Colors represent cell densities:red = high, blue = low. The two different identified subpopulations are outlined by green (SCA1HCD34H) or yellow (SCA1LCD34L) ovals. (D) Contour representations of the viSNE maps in the nine different cell preparations. Regions of interest identifying cell subpopulations that characterize the different biological conditions are circled (A to E in the top left panel).
- Figure S2. related to Fig 1. viSNE analysis of the multiparametric data of the FAP preparations.
The single-cell multiparametric data obtained in the mass cytometry experiment described in Fig 2 was projected onto a two-dimensional space by applying the viSNE algorithm (Amir el et al, 2013). (A) List of metal-tagged antibodies used in the mass cytometry experiment. (B) Dot representations of the viSNE maps, where each dot represents a cell. In the different maps, dots are colored according to the intensity of expression of the 12 antigen readouts (SCA1, CD34, CD146, CD140b, CD31, CXCR4, CAS3, Vim, pSTAT1, TNF-α, pCREB and pSTAT3). (C) Bar plots representing the relative abundance of the two subpopulations expressing different levels of SCA1 and CD34.
- Figure S3. related to Fig 2. Modulation of FAP adipogenesis by perturbations of the NOTCH, WNT, and Hedgehogpathways.
FAPs were isolated from C57Bl/6 mice and treated every 48 h for 8 d with activators and inhibitors of three selected pathways to perturb their adipogenic differentiation. (A) Compounds and concentrations used in the experiment are listed in table. (B) Adipocytes were detected by ORO stain, and nuclei were counterstained with DAPI. Scale bar: 100 μm. (C, D) The average number of nuclei and (D) the percentage of ORO–positive cells were determined using the CellProfiler software. Data are represented as average ± SEM of four different experiments. Statistical significance was evaluated by the ANOVA test (*P < 0.05). HH, Hedgehog; DLL1, Delta like protein 1; DKK1, Dickkopf WNT Signaling Pathway Inhibitor 1; WNT10b, Wnt Family Member 10B; ITR, Itraconazol; SAG, Smoothened Agonist
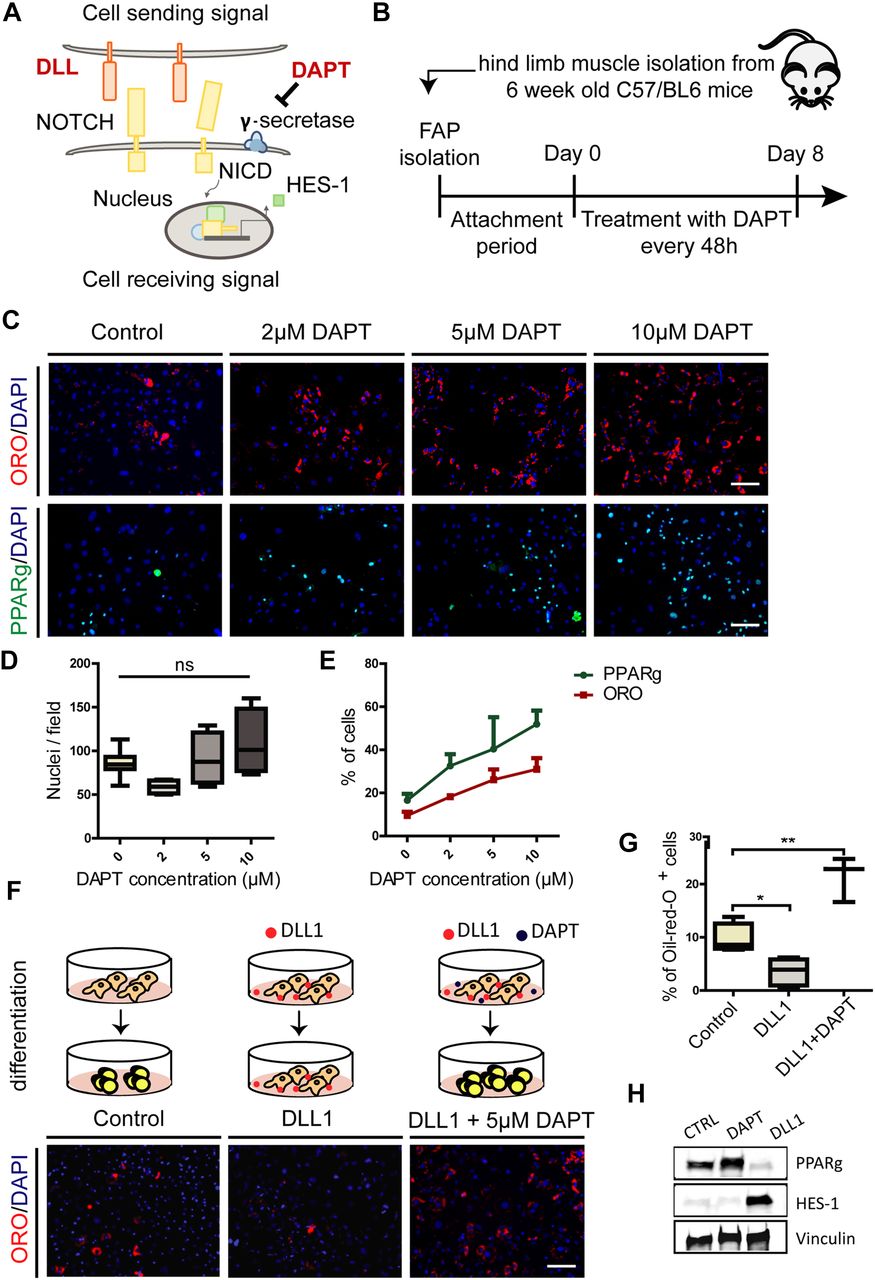
- Figure 2. Perturbation of the NOTCH pathway modulates FAP differentiation into adipocytes.
(A) Simplified model of canonical NOTCH signaling. DAPT (N-[N-(3,5-difluorophenacetyl)-l-alanyl]-S-phenylglycine t-butylester) is a synthetic inhibitor of γ-secretase. (B) Schema of the experimental procedure. Attachment period lasted for 4 d. (C) FAPs were isolated from wild type (wt) C57BL/6 mice, cultivated in DMEM + 20% FBS, and treated upon attachment with 2, 5 and 10 μM of DAPT every 48 h for 8 days. Adipocytes were detected by Oil red O (ORO) stain or PPARg and nuclei were counterstained with DAPI. Scale bar: 100 μm.(D) The average number of nuclei are presented as a box plot (n = 4). (E) Line graph showing the percentage of ORO–positive and PPARg-positive cells represented as average ± SEM of four different experiments (n = 4). (F) FAPs isolated from hind limb muscles of C57BL/6 mice were plated on DLL1-Fc or IgG2A-Fc (control)–coated surface in DMEM + 20% FBS. In addition, FAPs were plated on DLL1-Fc–coated surface and treated with 5 μM DAPT every 48 h for 8 d. Adipocytes were detected with ORO stain and nuclei were counterstained with DAPI. Scale bar: 100 μm.(G) The percentage of ORO–positive cells of at least three different experiments are shown in the graphs. All quantifications were done using the CellProfiler software. Box plots show median and interquartile range with whiskers extended to minimum and maximum values. Statistical significance was evaluated by the ANOVA test (*P < 0.05, **P < 0.01). (H) Western blot analysis of HES-1 and PPARg protein levels in control, DAPT-treated and DLL1-treated cells. Proteins (30 μg) from FAP whole cell lysates were separated by electrophoresis on an SDS acrylamide (4–15%) gel and blotted onto nitrocellulose paper. Vinculin was used as a loading control (n = 3).
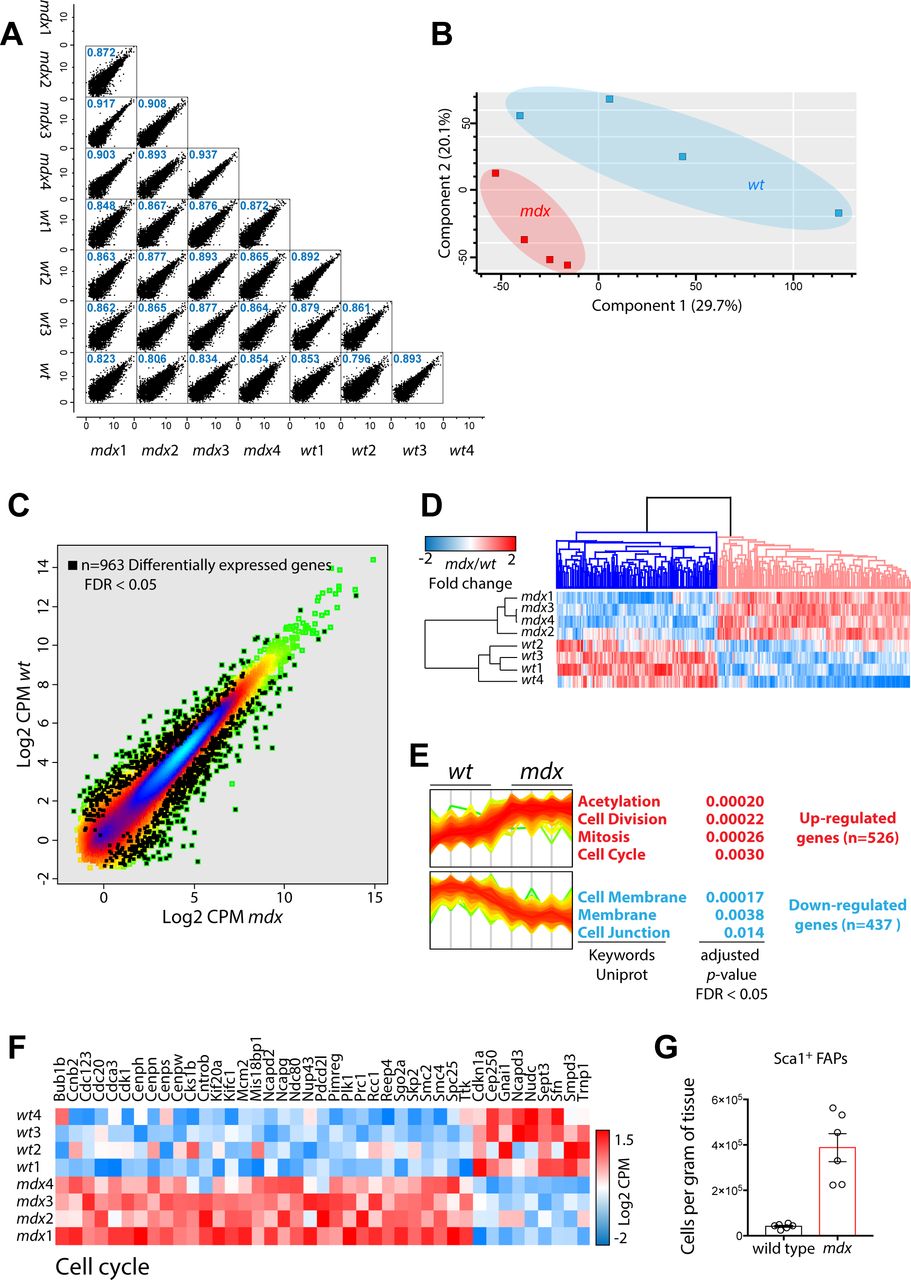
- Figure S4. Transcriptomics of wt and mdx FAPs.
(A) Sample correlation between biological replicates. (B) Principal component analysis. (C) Density scatterplot reporting of the log2 CPM (counts per million) of the detected transcripts. Black squares represent differentially expressed (FDR < 0.05) genes. (D) Heat map representing the hierarchical clustering of the significant differentially expressed genes in the two conditions. (E) Intensity line plot of the up-regulated (upper panel) and down-regulated (lower panel) genes. For both clusters, a gene set enrichment is reported and annotated according to Uniprot keywords. (F) Heat map reporting the log2CPM expression of those genes annotated as “cell cycle regulators.” (G) Number of freshly isolated wt and mdx FAPs normalized per gram of muscle (n = 6).
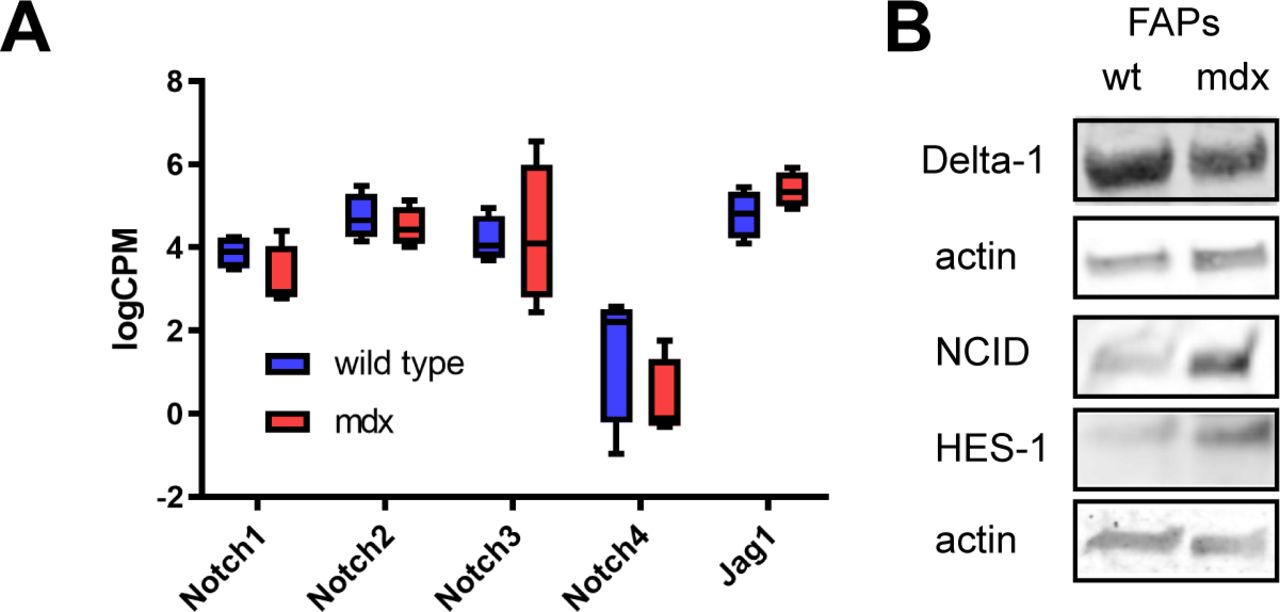
- Figure S5. Expression of core members of NOTCH signalling pathway in wt and mdx FAPs.
(A) Log2CPM expressions of NOTCH receptors and JAG1 ligand in wt and mdx FAPs, obtained from transcriptomic analysis. (B) Western blot analysis of DLL1, NCID, and HES-1 expression in wt and mdx FAPs. Actin was used as the loading control.
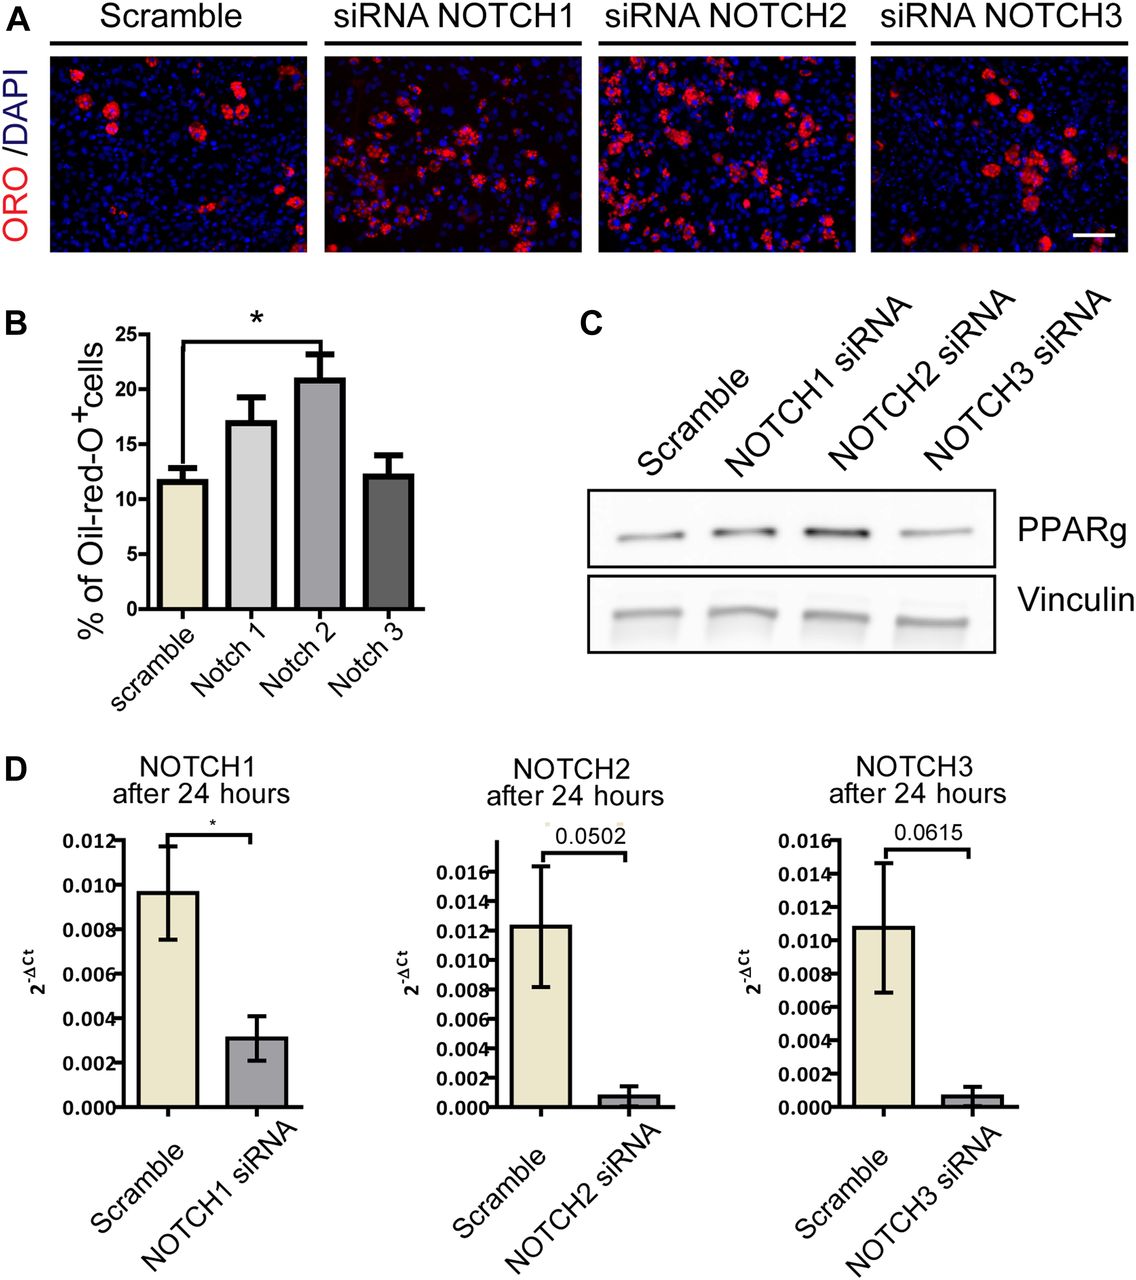
- Figure 3. siRNA knockdown of NOTCH receptors promotes FAPs adipogenesis.
FAPs were isolated from C57BL/6 mice incubated with 50 nM of three different smart-pool of NOTCH (NOCTH1, NOTCH2 and NOTCH3) or of a scramble siRNA used as control. To evaluate the effects of the NOTCH silencing on adipogenic differentiation, cells were maintained in adipogenic media for 3 d, 48 h after silencing. (A) Adipocytes were stained with ORO and nuclei with DAPI. Scale bar: 100 μm. (B) The percentages of ORO–positive cells are shown in the graphs (n = 3). Quantifications were done using the CellProfiler software. (C) Western blot analysis of PPARg expression 48 h after silencing. Vinculin was used as loading control (n = 3). (D) RT-PCR analysis of NOTCH receptors expression 24 h after silencing (n = 3).
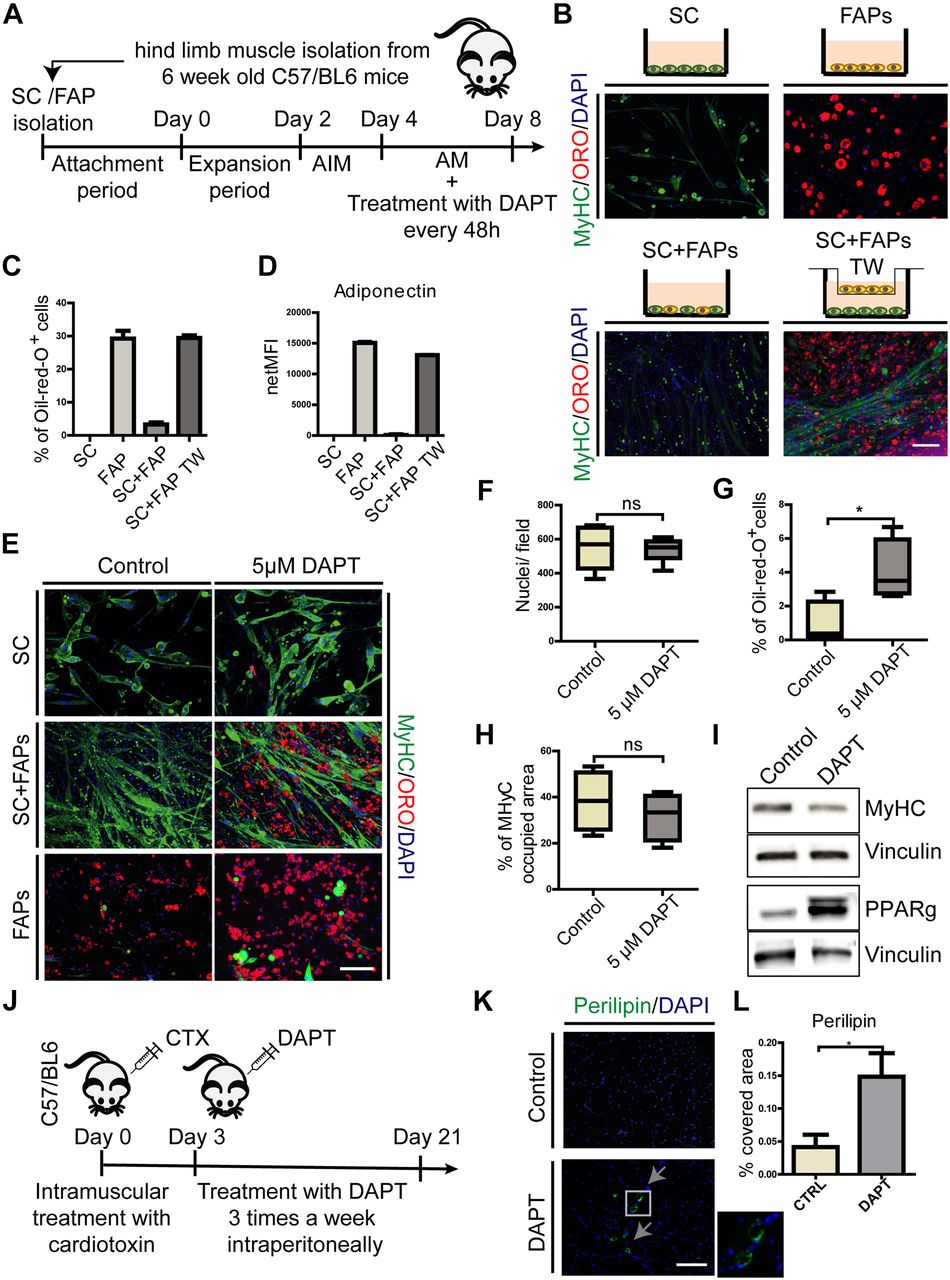
- Figure 4. Myotube inhibition of FAP adipogenesis is dependent on NOTCH activity.
(A) Schema of the experimental procedure. (B) SCs and FAPs were cultured separately or cocultured (directly or in transwell [TW]) in SC growth medium for 2 d, followed by 2 d in AIM and 4 d in adipogenic maintenance medium (AM). Cells were stained with anti myosin heavy chain (MYHC) antibodies, ORO and DAPI. Scale bar: 100 μm. (C, D) The percentage of cells stained with ORO and (D) the amount of adiponectin secreted in the culture medium were quantitated and reported as bar graphs showing average ± SEM (n = 2). (E) SCs and FAPs were cocultured and treated with 5 μM DAPT every 48 h. Cells were stained with anti-MYHC antibodies, ORO and DAPI. Scale bar: 100 μm. (F–H) Box plots representing the average number of nuclei per field, the fraction of cells stained with ORO and the fraction of pixels stained with anti MYHC antibodies, respectively. Quantifications were done using the CellProfiler software. Box plots show median and interquartile range with whiskers extended to minimum and maximum values (n = 4). Statistical significance was evaluated by the t test (*P < 0.05). (I) Proteins (30 μg) from the coculture cell lysates were separated by SDS–PAGE. Western blot analysis of MYHC and PPARg expression in control and treated cocultures. Vinculin was used as a loading control (n = 3). (J) Schema of in vivo experiment. 6-wk-old wt, C57BL/6, mice were injected with cardiotoxin (10 μM) and, starting from day 3 after injury, were treated with 30 mg/kg DAPT or vehicle, intraperitoneally three times a week until day 21. (K) Representative TA sections of control and mice treated with DAPT stained with perilipin and DAPI (n control = 4 mice, n DAPT = 4 mice). Scale bar: 100 μm. (L) Graph showing quantification of perilipin covered area on TA sections, performed with ImageJ software. Statistical significance was evaluated by the t test (*P < 0.05).
- Figure 5. mdx FAPs are unresponsive to DLL1 activation of NOTCH signaling.
(A) FAPs isolated from young (6-wk-old) mdx mice were plated on DLL1-Fc or IgG2A-Fc (control)–coated surface in growth medium for 8 d. Adipocytes were stained with ORO and nuclei with DAPI. Scale bar: 100 μm. (B, C) The average number of nuclei and percentage of adipocytes are presented as box plots (n = 4). (D) FAPs isolated from ctx-treated C57BL/6 mice 3 d after treatment were plated on DLL1-Fc or IgG2A-Fc (control) coated surface in growth medium for 8 d. Adipocytes were stained with ORO and nuclei with DAPI. Scale bar: 100 μm. (E, F) The average number of nuclei and percentage of adipocytes are presented as a box plot (n = 3). All quantifications were done using the CellProfiler software. Box plotsshow median and interquartile range with whiskers extended to minimum and maximum values. Statistical significance was evaluated by t test (*P < 0.05). (G, H) Expression of HES-1 in FAPs from the three experimental conditions (wt, mdx, and ctx) was evaluated. Proteins were isolated from freshly isolated FAPs from wt, mdx and ctx-treated mice, and the expression of HES-1 was detected by immunoblotting and (H) quantifiedby densitometric analysis (n = 3). Actin was used as a loading control. Statistical significance was evaluated by the ANOVA test (*P < 0.05, ***P < 0.001).
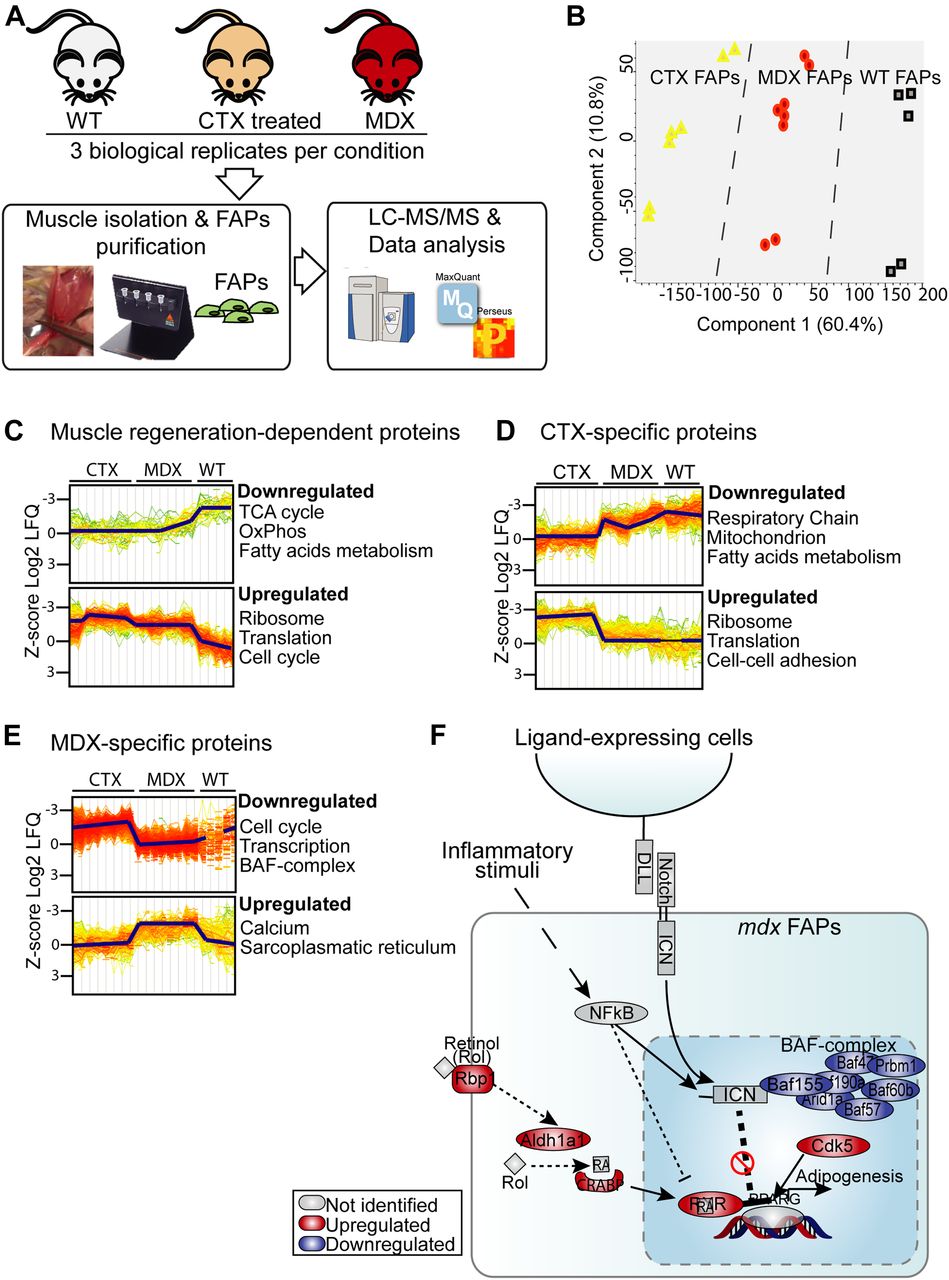
- Figure 6. Deep MS-based proteomic approach reveals mechanisms underlying the different sensitivity of mdx FAPs to NOTCH stimulation.
(A) Schematic representation of the experimental strategy applied to analyze the proteome of FAPs isolated from wt, mdx, and ctx-treated mice. (B) Principal component analysis highlighted a good separation of wt, mdx, and ctx FAP proteomic profiles. (C–E) GO “Biological Process” and pathways enrichment analysis in selected groups of significantly modulated proteins (t test, FDR < 0.07). (F) Model recapitulating the mechanisms identified by the MS-based proteomic approach through which mdx FAPs may escape the NOTCH-dependent inhibition of adipogenesis. The proteins that are up- or down-regulated in mdx FAPs when compared with ctx FAPs are in red and blue, respectively.
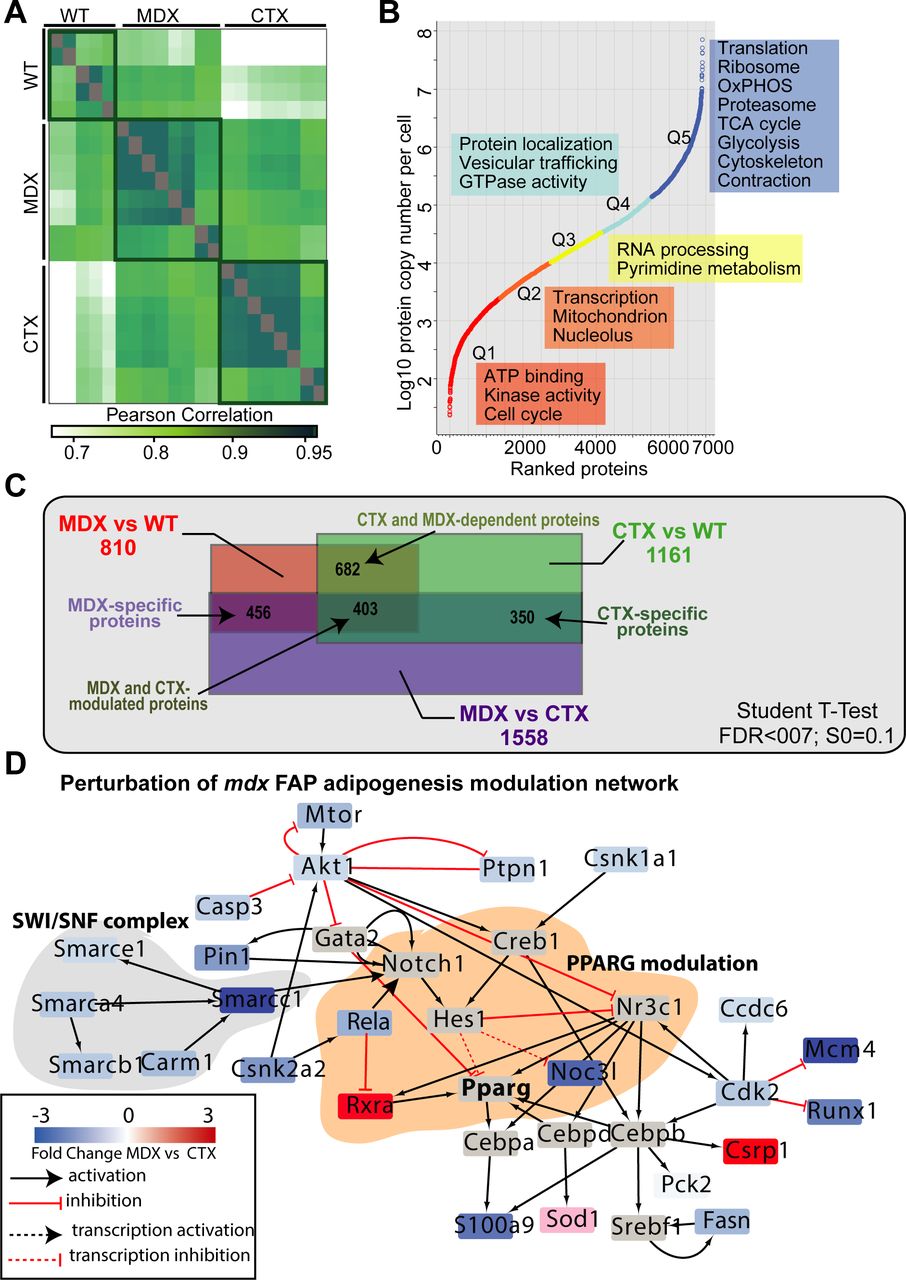
- Figure S6. related to Fig 6. MS-based proteomic characterization of mdx, ctx, and wt FAPs.
(A) Heat map showing the Pearson's correlation coefficients between the different biological replicates. (B) Dynamic range of the proteins of measured samples based on their Log10 label-free intensities (LFQ). Enrichment analysis of GO Biological Processes and pathways in each quantile. (C) Venn diagram showing the overlap between the significantly modulated proteins in mdx, ctx, and wt FAPs. (D) Proteomic data were overlaid onto the signaling adipogenic network extracted from Signor database (Perfetto et al, 2016) and filtered to keep only the proteins significantly modulated exclusively in mdx FAPs.
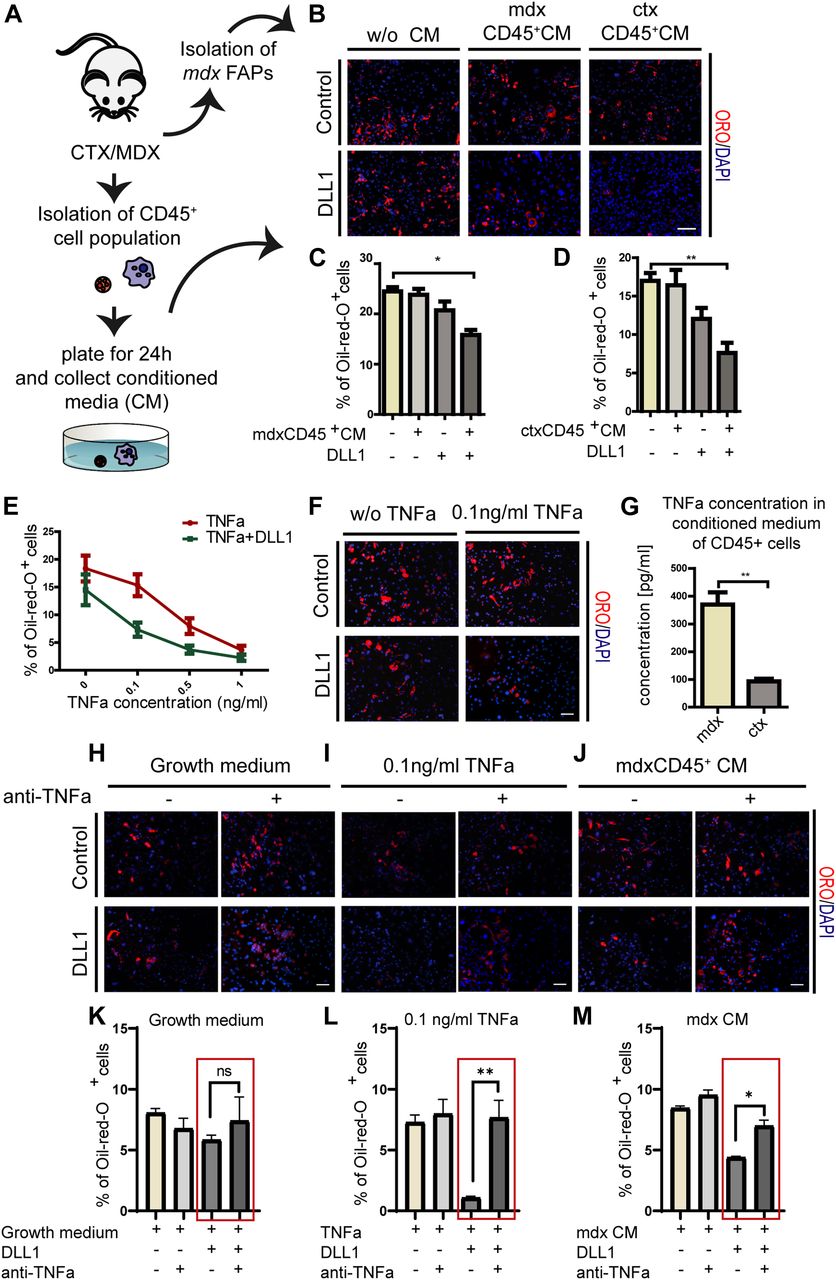
- Figure 7. Signals secreted from inflammatory cells relieve the mdx FAP insensitivity to inhibition of adipogenesis mediated by NOTCH activation.
(A) Schema of the experimental procedure. (B) FAPs were isolated from mdx mice, seeded on plates containing DLL1-Fc or IgG2A-Fc, and treated every 48 h with conditioned media (CM) obtained from CD45+ cells from ctx and mdx mice. To obtain CD45+ CM, the CD45+ cell fraction was seeded for 24 h in RPMI medium containing 10% FBS. After 24 h, the CM was collected, filtered to remove unattached cells and debris, and stored at 4°C. Adipocytes were stained with ORO and nuclei with DAPI. Scale bar: 100 μm. (C, D) Bar plots are presenting the percentages of adipocytes of at least three different experiments. (E) mdx FAPs ± DLL1 were treated with 0.1, 0.5, and 1 ng/ml TNFa and the percentage of adipocytes was quantified. Data are represented as average ± SEM (n = 3). (F) Representative immunofluorescence images of adipogenesis of FAPs treated with 0.1 ng/ml TNFa in the presence of the NOTCH ligand DLL1. Adipocytes were stained with ORO and nuclei with DAPI. Scale bar: 100 μm. (G) Comparison of concentrations of TNFa in CM obtained from mdx and ctx CD45+ cells measured by ELISA. (H–J) mdx FAPs ± DLL1 were treated with anti-TNFa antibody in three conditions: growth medium, 0.1 ng/ml TNFa, and mdx CD45+ CM. Adipocytes were stained with ORO and nuclei with DAPI. Scale bar: 100 μm. (K–M) Bar plots representing the percentage of adipocytes. Data are represented as average ± SEM (n = 2). All quantifications were done using the CellProfiler software. Statistical significance was evaluated by the ANOVA test (*P < 0.05, **P < 0.01).
- Figure S7. related to Fig 7. TNF-α promotes NFKB migration into nuclei.
The panel shows representative images of FAPs isolated from ctx-treated C57BL/6 mice 3 d after treatment, cultured for 4 d in growth medium and then treated for 48 h with different concentrations of TNFa. Cells were stained for NFKB (green), whereas DAPI was used to reveal nuclei (blue). Scale bar: 20 μm.
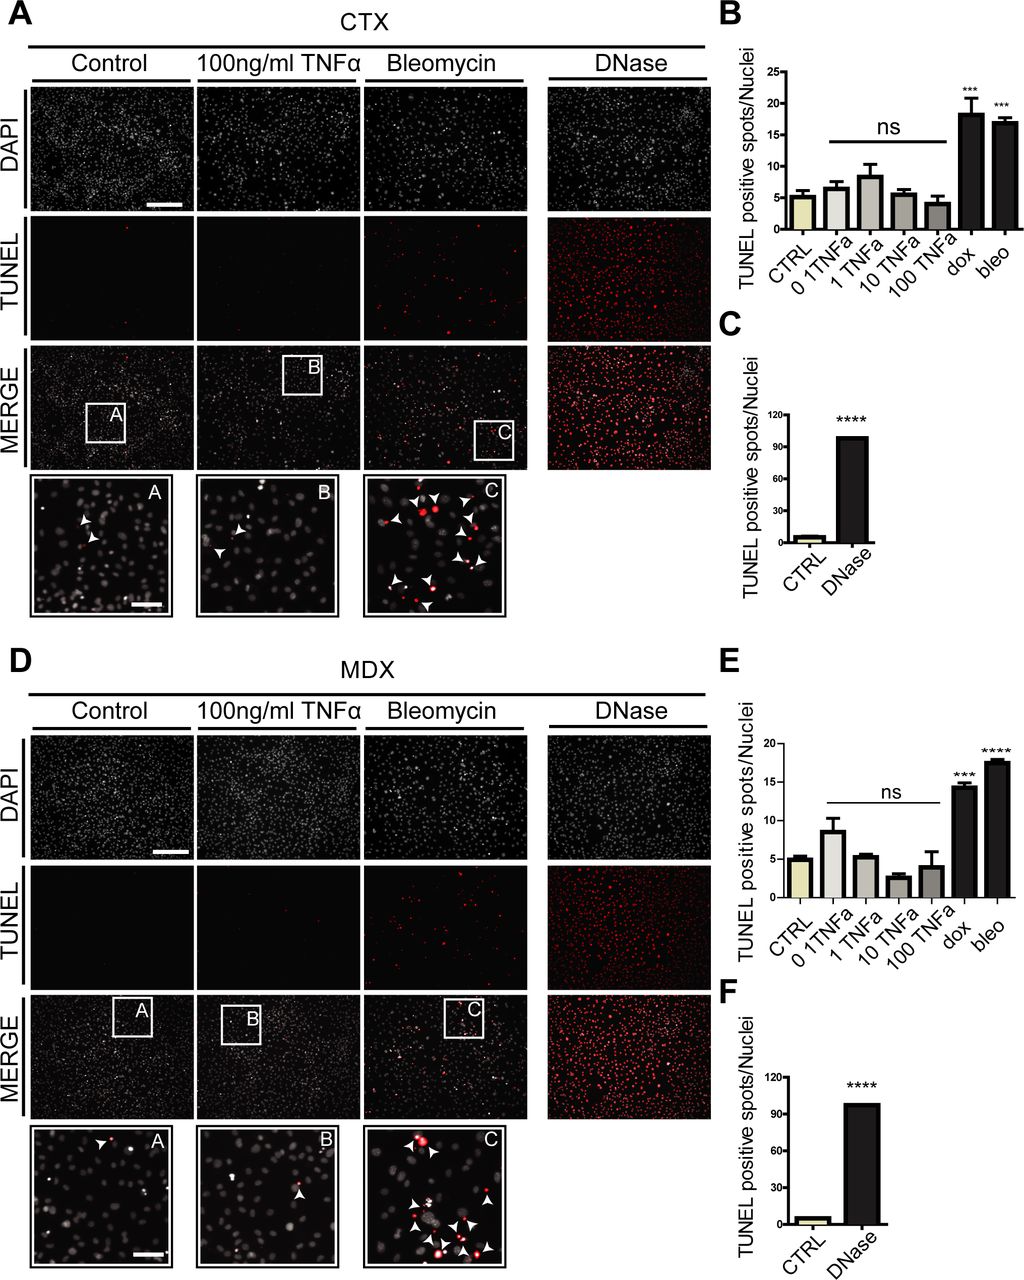
- Figure S8. related to Fig 7. TNFa does not promote apoptosis of ctx and mdx FAPs.
(A, D) FAPs isolated from ctx-treated C57BL/6 mice 3 d after treatment (A) or FAPs isolated from young (6-wk-old) mdx mice (D) were cultured for 4 d in growth medium and then treated for 48 h with different concentrations of TNFa, doxorubicin (0.5 μM), or bleomycin (2 μM). The immunofluorescence microphotographs show apoptotic cells detected by TUNEL staining (red) counterstained with DAPI for nuclei (gray). Scale bar: 200 μm. White arrows within the insets indicate apoptotic spots. Scale bar: 50 μm. DNase treatment was used as positive control for TUNEL staining. (B, C) Bar plots represent the percentage of TUNEL-positive spots per field for ctx FAPs treated with TNFa (B) or DNase (C). (E, F) The same information for mdx FAPs are reported in the bar plots (E, F). Data are represented as average ± SEM (n = 3), and statistical significance was evaluated using the one-way ANOVA test (*P < 0.05, **P < 0.01, ***P < 0.001, ****P < 0.0001).
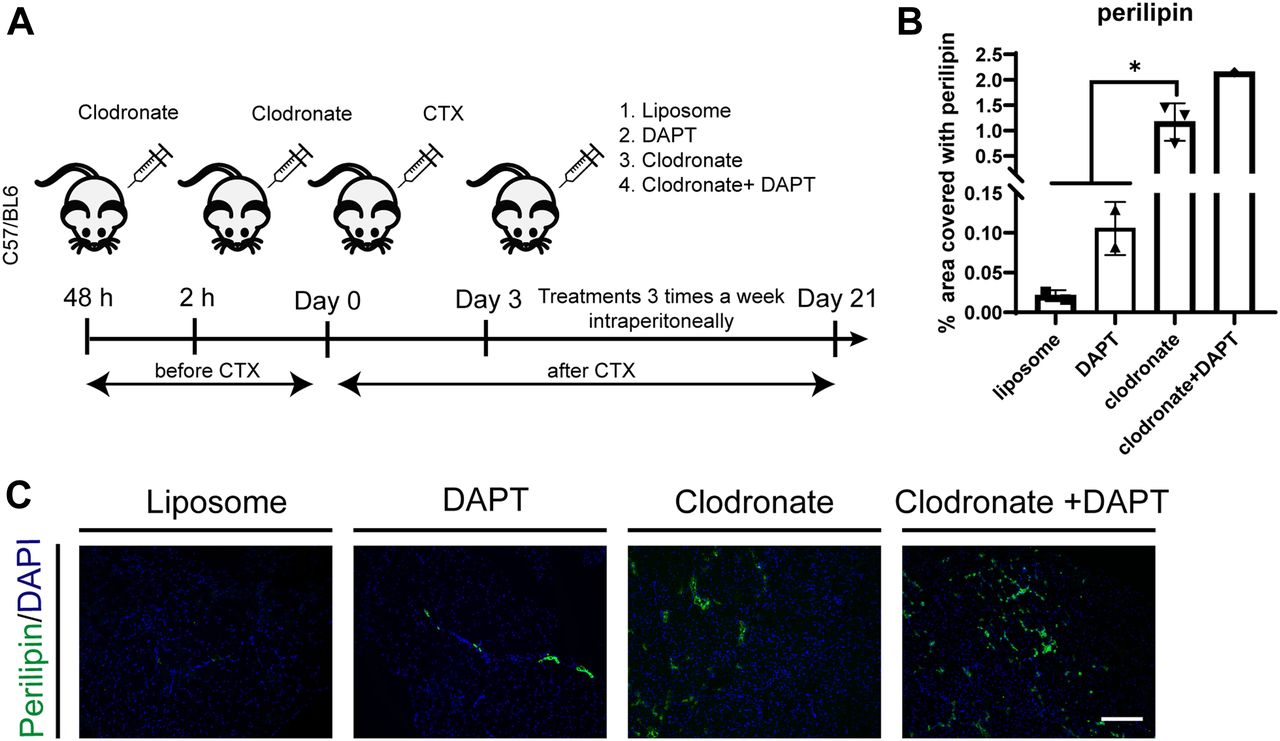
- Figure 8. Macrophage depletion alters skeletal muscle regeneration and causes fatty tissue infiltration after muscle injury in vivo.
(A) Schema of in vivo experiment. 6-wk-old wt, C57BL/6, mice were injected with liposomes 48 and 2 h before cardiotoxin (10 μM) injection. After 3 d from ctx injury, mice were treated with liposome, clodronate, DAPT, or clodronate + DAPT, intraperitoneally three times a week until day 21. (B) Quantification of perilipin on TA sections, performed with ImageJ software. (C) Representative TA sections of control (liposome) and treated mice stained with perilipin and DAPI (n liposome = 2 mice, n DAPT = 2 mice, n clodronate = 3, n clodronate + DAPT = 1). Scale bar: 100 μm. Statistical significance was evaluated by the ANOVA test (*P < 0.05, **P < 0.01).


Supplementary Materials
Table S1 Raw data of CyTOF analysis.
Table S2 Raw data of proteomic analysis.


In this Issue
Subjects
Related Articles
Cited By...
- Wnt7a Suppresses Adipogenesis of Skeletal Muscle Mesenchymal Stem Cells and Fatty Infiltration Through the Alternative Wnt-Rho-YAP/TAZ Signaling Axis
- Transferrin receptor (Tfr1) ablation in satellite cells impacts skeletal muscle regeneration through the activation of ferroptosis
- SCA-1 micro-heterogeneity in the fate decision of dystrophic fibro/adipogenic progenitors
- Metabolic reprogramming of fibro/adipogenic progenitors facilitates muscle regeneration
- Cross-talk between TGF-{beta} and PDGFR{alpha} signaling pathways regulates the fate of stromal fibro-adipogenic progenitors