


Article Figures & Data
Figures
- Figure 1. Generation of epidermis-specific and constitutive ninein-knockout mice.
(A) From top to bottom: parental genomic locus with exons 1–3 (allele WT); targeted locus containing both lacZ reporter and neomycin selection genes, flanked by FRT-sites (allele TM1A); the floxed allele had the exon 2 flanked with two loxP sites (allele Fl) and the deleted ninein allele upon Cre-mediated excision of exon 2 (allele Del). Boxes represent exons; ovals and arrowheads represent FRT-sites and loxP sites, respectively. (A–E) Primers for PCR genotyping (A–E) are indicated as arrows. Upon Cre-mediated deletion, only exon 1 is preserved, which codes for the N-terminal 61 amino acids of ninein. (B) PCR analysis of genomic DNA from nontransgenic wild-type mice (WT), transgenic founder mice (WT/TM1A), and ES-cells (WT/TM1A), using primers A, B to amplify the sequence of the WT allele (457 bp) and using primers A, C and D, E for the targeted locus (TM1A) (329 bp and 293 bp), respectively. (C) Left: To generate mice with epidermis-specific ninein knockout, crosses were made between mice carrying the floxed allele (Fl/Fl), and mice heterozygous for the floxed allele and K14-Cre (Fl/WT; K14 Cre/0). Three different genotypes are characterized by PCR analysis of genomic DNA [tail biopsies], (Fl/WT; 0/0), (Fl/Fl; K14 Cre/0), and (Fl/WT; K14 Cre/0). For simplification, they are referred to as “WT,” cKO,” and “het,” respectively. Primers A, B were used to detect the wild-type (457 bp) or the floxed (586 bp) ninein allele. Primers A, E detected exclusively the deleted allele (298 bp). Specific primers “Cre” amplified the K14-Cre gene (374 bp). Right: for the generation of the constitutive ninein-KO, we crossed (Fl/WT; PGK1-Cre/0) mice carrying PGK1-Cre, with (Fl/Fl) mice, to generate offspring that had the above characterized, and deleted the ninein allele in all cells and that transmitted it through the germline. PGK1-Cre was lost in repeated crossings, yielding heterozygous (het) mice (WT/Del; 0/0) and KO mice (Del/Del; 0/0). (D, E) Relative amounts of ninein mRNA in MEFs from WT and ninein-KO embryos, or (E) from keratinocytes obtained from WT and ninein-KO embryos, determined by quantitative PCR. The value for WT cells was set to 1 (error bars, SEM; triplicates from three independent experiments, ****P < 0.0001). (F) MEFs from WT, heterozygous, and ninein-KO E14.5 embryos were lysed and probed by Western blotting with antibodies against the C terminus of ninein, and against GCP2 as a loading control. Positions of molecular weight markers (kD) are indicated. (G) Immunofluorescence of ninein (N-terminal domain) and γ-tubulin in sections of epidermis from WT or ninein-cKO newborn mice. The dotted line represents the interface between dermis (der) and epidermis (epi); arrowheads and arrows point to centrioles in the dermis or epidermis, respectively. In the WT epidermis, only one centriole within a γ-tubulin–positive pair is ninein positive. Note the absence of ninein from centrosomes in ninein-cKO epidermis. (H) Immunofluorescence of tissue (cross-section) from WT and ninein-KO E14.5 embryos, using antibodies against ninein (N-terminal domain) and pericentrin. Note the absence of ninein from pericentrin-positive centrosomes in ninein-KO tissue. (I) Immunofluorescence of MEFs from Het (Del/WT) and ninein-KO E14.5 embryos, using antibodies against ninein (N-terminal domain) and γ-tubulin. Some areas of the cytoplasm display unspecific staining with the ninein antibody. Note the absence of ninein from γ-tubulin–positive centrosomes in ninein-KO MEFs. Bars (G, H, I), 10 μm.
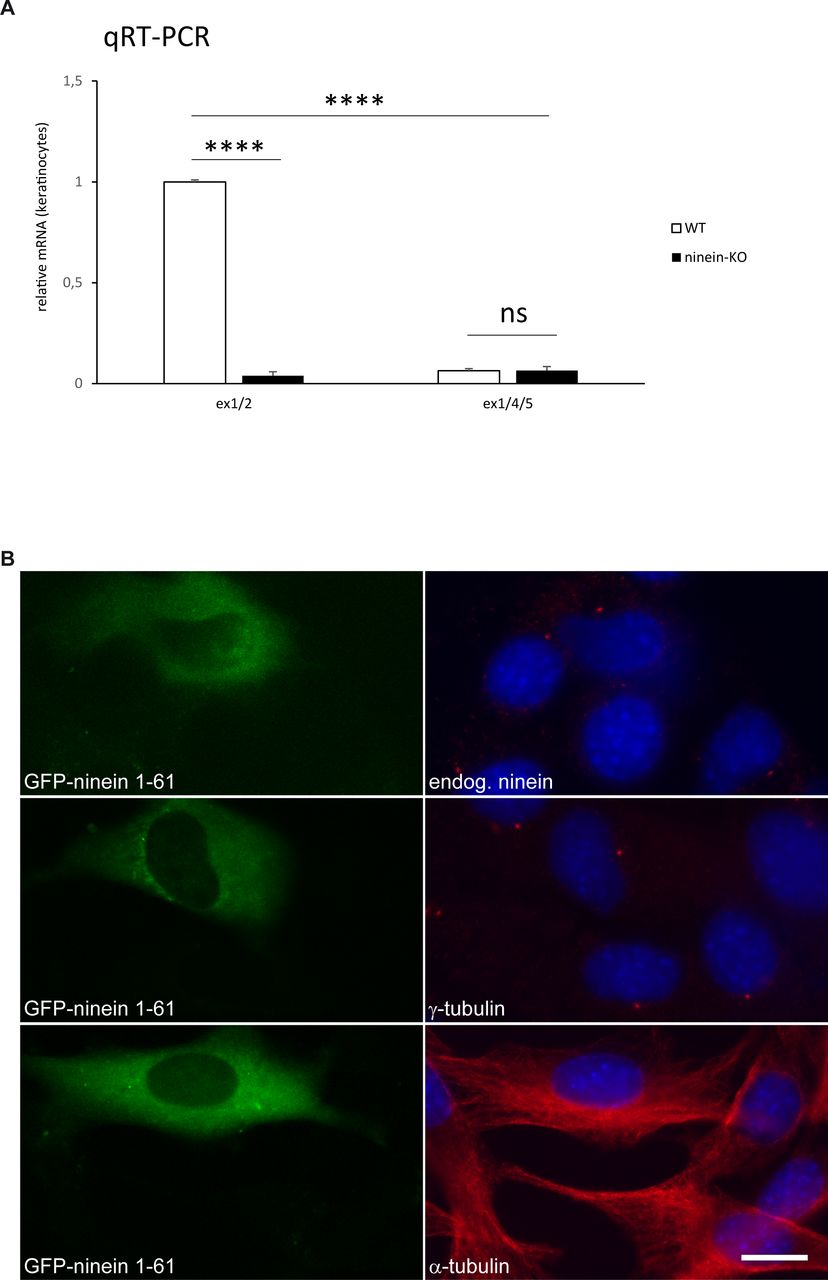
- Figure S1. After removal of ninein exon 2, remaining exons have no dominant effect.
(A) Relative amounts of ninein mRNA in keratinocytes obtained from WT and ninein-KO neonates determined by quantitative PCR. The following transcripts were amplified: transcripts containing exons 1/2 present in all four WT isoforms, coding for ninein protein and produced in WT cells but not in KO cells. After Cre-mediated excision of exon 2, the resulting transcripts containing exons 1/3 are predicted to generate a truncated protein in all four isoforms which may be subjected to nonsense-mediated decay (NMD) (IKMC-EUCOMM Project ID: 70308). In case of alternative splicing between exon 1 and exon 4, transcripts containing exons 1/4/5 are predicted, which would be protein coding, but missing 82 amino acids corresponding to exons 2 and 3. Quantification of these transcript shows that they are barely produced in WT or KO cells. The value for WT cells was set to 1 (error bars, SEM; triplicates from three independent experiments, ****P < 0.0001). (B) Mouse C2C12 cells were transfected with a construct encoding an EGFP-tagged fragment of ninein amino acids 1–61 (green) and stained with antibodies (red) against endogenous ninein, γ-tubulin, or α-tubulin. Blue, DNA. Bar, 10 μm.
- Figure S2. Macroscopically normal epidermis in ninein-KO mice, displaying reduced levels of filaggrin protein.
(A) Newborn pups of WT, ninein-cKO, and ninein-KO genotypes. (B) Sections of epidermis from WT and ninein-cKO newborn mice, stained with antibody against filaggrin. The dotted lines represent the interface between dermis (der) and epidermis (epi). (C) Sections of epidermis from WT and ninein-KO newborn mice, stained with antibody against loricrin. The dotted lines represent the interface between dermis (der) and epidermis (epi). (D) Relative amounts of mRNA of filaggrin, desmoglein 1, corneodesmosin, and ninein-like protein, in keratinocytes obtained from WT and ninein-KO newborn mice, determined by quantitative PCR. The value for WT cells was set to 1 (error bars, SD; six embryos were analyzed for each experiment). Bars (B, C), 10 μm.
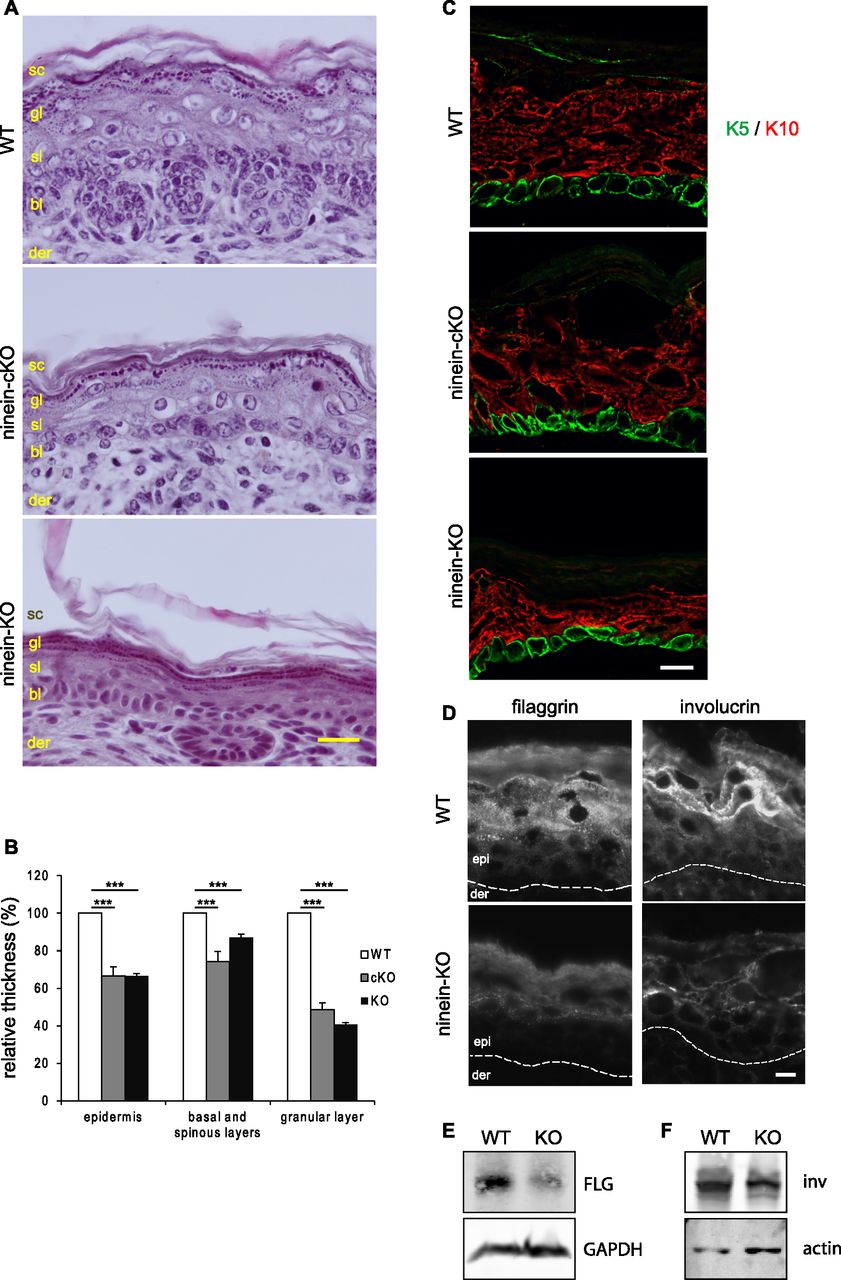
- Figure 2. Mice lacking ninein grow a thinner epidermis with impaired differentiation of suprabasal cells.
(A) Sections of the epidermis from WT or ninein-cKO newborn mice were stained with hematoxylin and eosin. Sc, stratum corneum; gl, granular layer; sl, spinous layer; bl, basal layer; der, dermis. (A, B) Relative thickness of epidermal layers, as shown in (A); values for the WT were set to 100%. Error bars, SEM; at least four skin sections (three regions per section) from at least four embryos (three independent matings) were measured; ***P < 0.001. (C) Sections of epidermis from WT, ninein-cKO, and ninein-KO newborn mice were stained with antibodies against keratin 5 (green) and keratin 10 (red). (D) Sections of the epidermis from WT or ninein-KO newborn mice were stained with antibodies against filaggrin or involucrin, as indicated. The dotted line represents the interface between dermis (der) and epidermis (epi). (E, F) Western blots of protein extracts from the epidermis of WT or ninein-KO embryos, probed with antibodies against (E) filaggrin and GAPDH (loading control) or with antibodies against (F) involucrin and actin (loading control). Bars (A), 20 μm; (C, D) 10 μm.
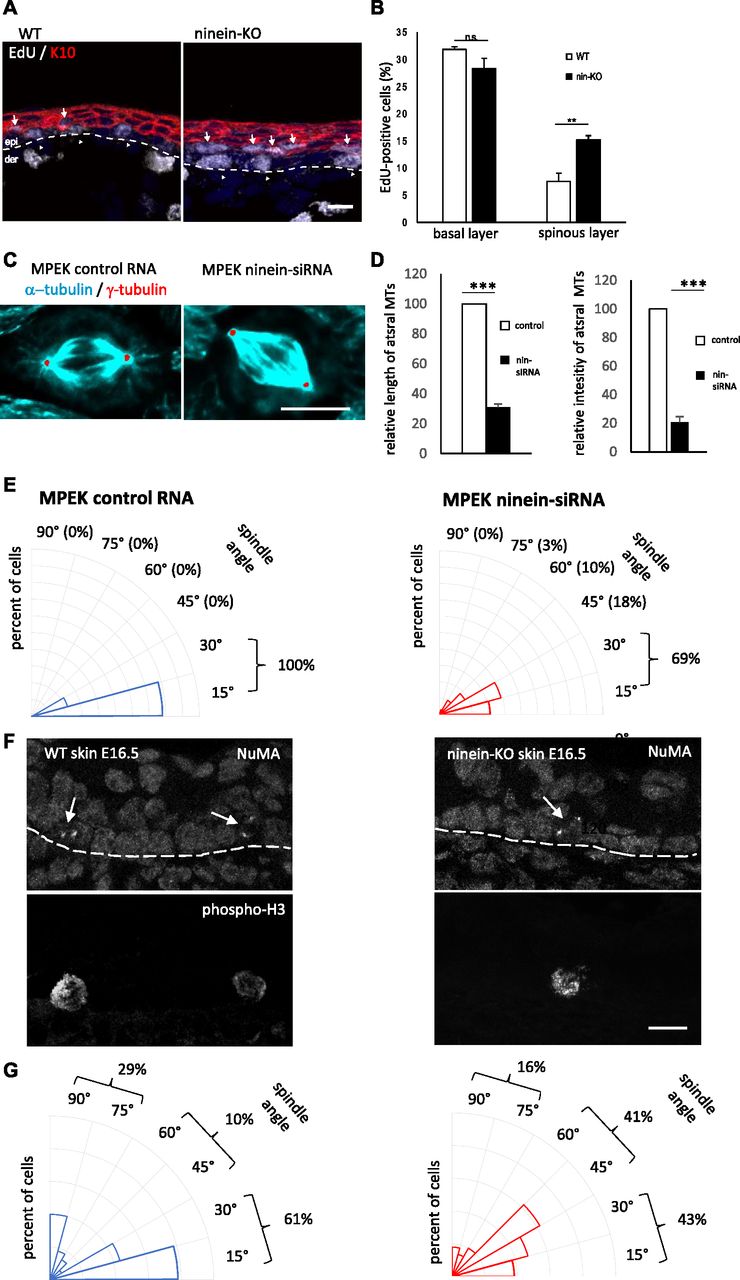
- Figure 3. Defects in spindle orientation in ninein-KO epidermis correlate with suprabasal differentiation defects.
(A) Sections of the epidermis from WT or ninein-KO E16.5 embryos after 1 h EdU incorporation were stained with antibodies against keratin K10 and EdU, to detect cells in the S-phase. The dotted line represents the interface between dermis and epidermis; arrowheads and arrows point to EdU-positive cells in the basal and suprabasal layers, respectively. (B) EdU-positive cells, as shown in (A), were counted in images covering at least 100 μm of basal and suprabasal layers (error bars, SEM; sections were quantified from three different embryos, five sections per embryo; **P < 0.001). (C) Metaphase spindles of keratinocytes (MPEK) after treatment with control RNA or with ninein-siRNA and stained with antibodies against α-tubulin (green) and γ-tubulin (red). For better visualization, the contrast of γ-tubulin was enhanced, the corresponding area selected with the tracing tool and overlaid onto the α-tubulin image. The staining of α-tubulin is slightly overexposed, to better visualize the astral microtubules. (D) Astral microtubules in mitotic MPEK were quantified for (left) length and (right) average intensity between spindle poles and the cell cortex, in cells treated with control or ninein-siRNA (n = 20 spindles per condition in at least three independent experiments, ***P < 0,001). (E) Radial histograms representing the frequency of spindle orientation angles in (left) dividing control and (right) ninein-siRNA–treated keratinocytes. Spindle orientation was determined by measuring the angle between the line connecting both spindle poles and the surface of the coverslip. 59 and 62 spindles in metaphase were quantified after control RNA and ninein-siRNA, respectively, in three independent experiments, ***P < 0.001. (F) Sections of the epidermis from WT or ninein-KO E16.5 embryos, stained with antibodies against NuMA and H3P, to detect spindle poles of mitotic basal progenitors. The dotted line represents the separation between dermis and epidermis and corresponds to the basal membrane. (G) Radial histograms representing the frequency of spindle orientation angles in (left) dividing control and (right) ninein-KO basal keratinocytes in the epidermis. Spindle orientation was determined by measuring the angle between the line connecting both spindle poles and the basal membrane. Sections were quantified from three different embryos, five sections per embryo; 46 to 58 metaphase spindles were quantified per genotype *P < 0.05). Bars (A), 20 μm; (C, F) 10 μm.
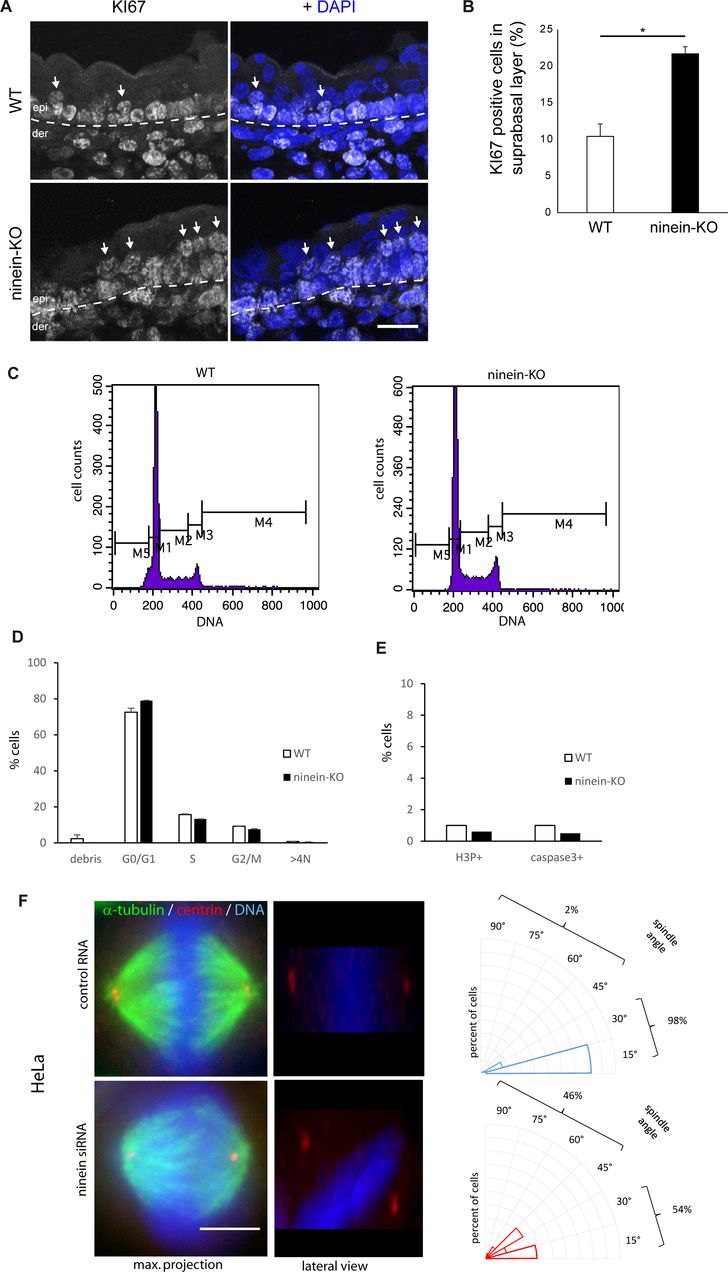
- Figure S3. The absence of ninein provokes minor defects in spindle orientation and in suprabasal differentiation.
(A) Sections of the epidermis from WT or ninein-cKO E16.5 embryos were stained with antibody against Ki67 and with DAPI to detect nuclei. The dotted line represents the interface between dermis (der) and epidermis (epi); arrows point to Ki67-positive cells in the suprabasal layers. (B) Ki67-positive cells, as shown in (A), were counted in images covering at least 100 μm of suprabasal layers (error bars, SEM; sections were quantified from three different embryos, five sections per embryo; *P < 0.05). (C) Cell cycle profiles of keratinocytes from WT and ninein-KO E17.5 embryos stained with propidium iodide and analyzed by flow cytometry. To quantify the percentage of cells in different phases of the cycle, the following windows were chosen: M1 (G0/G1), M2 (S-phase), M3 (G2/M), M4 (>4N), and M5 (debris). (D) Percentages of WT and ninein-KO keratinocytes in different phases of the cell cycle, as measured in (C) (n = 8 embryos per genotype, P > 0.05 for all). (E) Keratinocytes from WT and ninein-KO E17.5 embryos were stained for H3P and caspase 3 and analyzed by flow cytometry (n = 8 embryos per genotype). Graphs depict the proportion of cells in mitosis (H3P-positive) and apoptosis (caspase 3-positive). (F) Metaphase spindles of HeLa cells treated with control RNA and ninein-siRNA, stained for α-tubulin, centrin, and DNA (DAPI). Left: maximum intensity Z-projections of image stacks of mitotic spindles; middle: lateral projections of the same. Note the oblique spindle in the lateral view of the ninein-siRNA–treated cell. Right: radial histograms representing the frequency of spindle angles in control RNA-treated and ninein-siRNA–treated cells. Spindle orientation was determined by the relative angle between the line connecting both spindle poles (during late metaphase) and the surface of the coverslip (60 and 50 spindles were quantified for control and KD in three independent experiments, ***P < 0.001). Bars (A), 20 μm; (F) 10 μm.
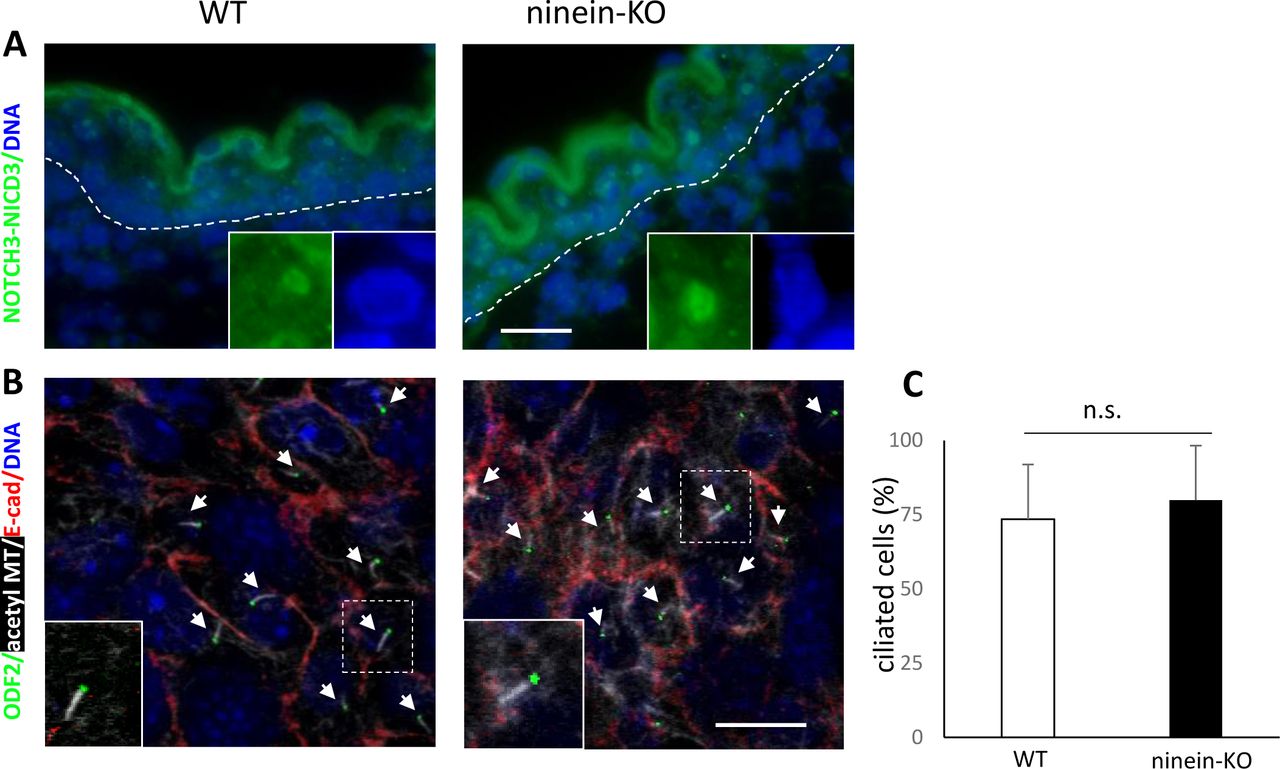
- Figure S4. Notch signaling and ciliogenesis are unaffected by ninein knockout.
(A) Sections of the epidermis from WT or ninein-KO embryos at stage E16.5 were stained with antibody against Notch3 intracellular domain NICD3 (green). Insets show magnified views of intranuclear localization of NICD3. DNA of nuclei, blue. (B) Confocal immunofluorescence of whole-mount epidermis from WT and ninein-KO E13.5 embryos (Z-projections) stained for cell borders using antibodies against E-cadherin (red) and for primary cilia using antibodies against ODF2 (green) and acetylated tubulin (white), as well as with DAPI for DNA (blue). Arrows point at the apical cilia in WT and KO cells. Insets show enlarged views of cilia. (C) Histogram representing the percentage of ciliated cells (over total basal cells) per genotype (n = 100 cells/embryo analyzed; five to six embryos per genotype from two to three independent matings; data are represented as mean ± SEM; P = 0.21). Bars, 10 μm.
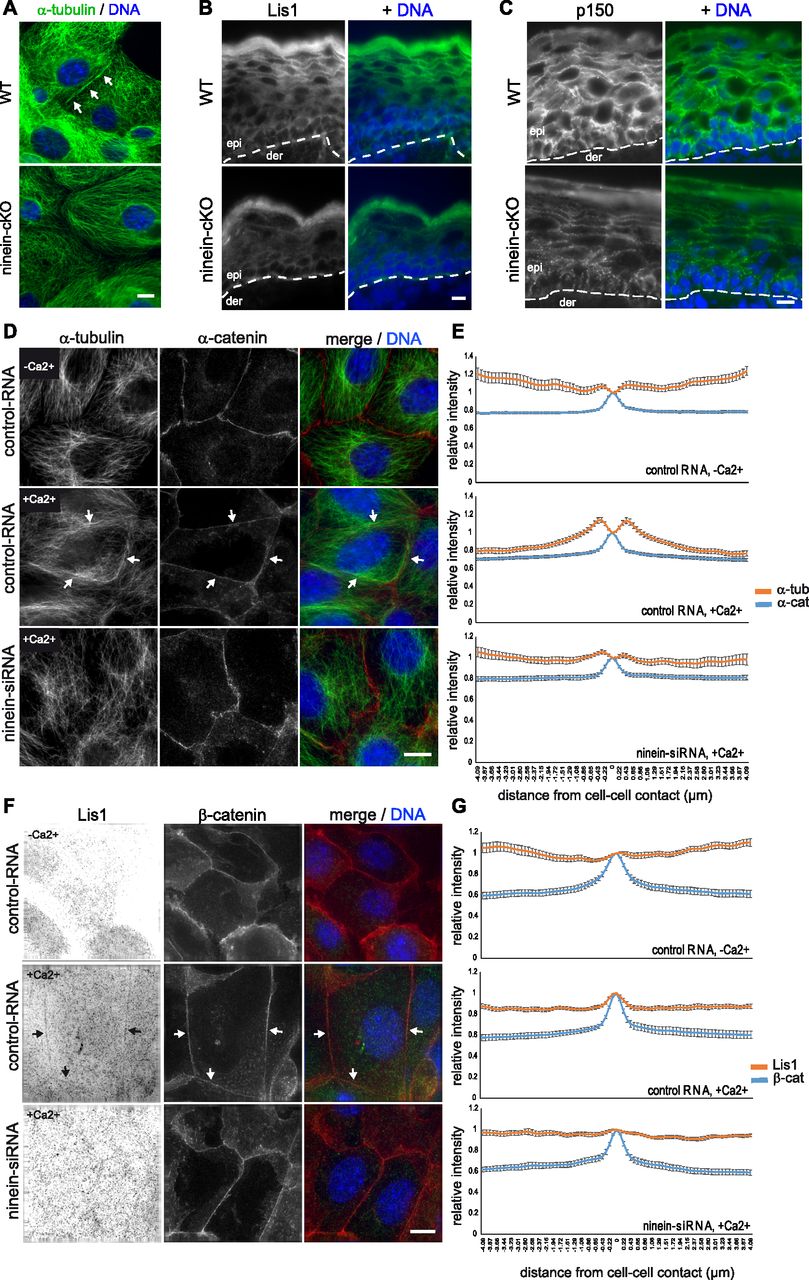
- Figure 4. Absence of ninein in differentiating keratinocytes prevents cortical organization of microtubules and cortical recruitment of Lis1 and dynactin p150.
(A) Primary keratinocytes, isolated from epidermis of WT and ninein-cKO newborn mice, were grown in culture, differentiated by addition of Ca2+, and immunostained with an antibody against α-tubulin. Arrows indicate cortical microtubule arrays in WT cells. Blue, DNA. (B, C) Immunofluorescence (green) of Lis1 or (C) dynactin p150 in epidermal sections from WT or ninein-cKO newborn mice. Blue, DNA. The dotted lines represent the interface between dermis (der) and epidermis (epi). (D) Immunofluorescence of α-tubulin (green) and α-catenin (red) in MPEK, transfected with control RNA or ninein-siRNA. Cells were fixed in growing conditions or after induction of differentiation by addition of Ca2+ for 24 h. Arrows indicate the cell cortex, where microtubules are reorganized in control cells. Blue, DNA. (D, E) Quantification of the fluorescence intensity of α-catenin (blue) and α-tubulin (orange) in the vicinity of the cell/cell interface, in growing or differentiated cells, as prepared in (D). The maximum value for α-catenin was used as a reference for the position of the cell borders, and intensity values were set to 1 at this position (error bars, SEM; at least 30 cells were quantified for each condition, from two independent experiments). (F) Immunofluorescence of Lis1 (green) and β-catenin (red) in MPEK, transfected with control RNA or ninein-siRNA. Cells were fixed in growing conditions or after induction of differentiation by addition of Ca2+ for 24 h. Arrows indicate areas of the cortex, where Lis1 is enriched in control cells. Inverted contrast is shown for Lis1, to improve visibility. Blue, DNA. (F, G) Quantification of the fluorescence intensity of Lis1 (orange) and β-catenin (blue) in the vicinity of the cell/cell interface, in growing or differentiated cells, as prepared in (F). The maximum value for β-catenin was used as a reference for the position of the cell borders, and intensity values were set to 1 at this position (error bars, SEM; at least 30 cells for each condition were analyzed, from two independent experiments). Bars (A–D, F), 10 μm.
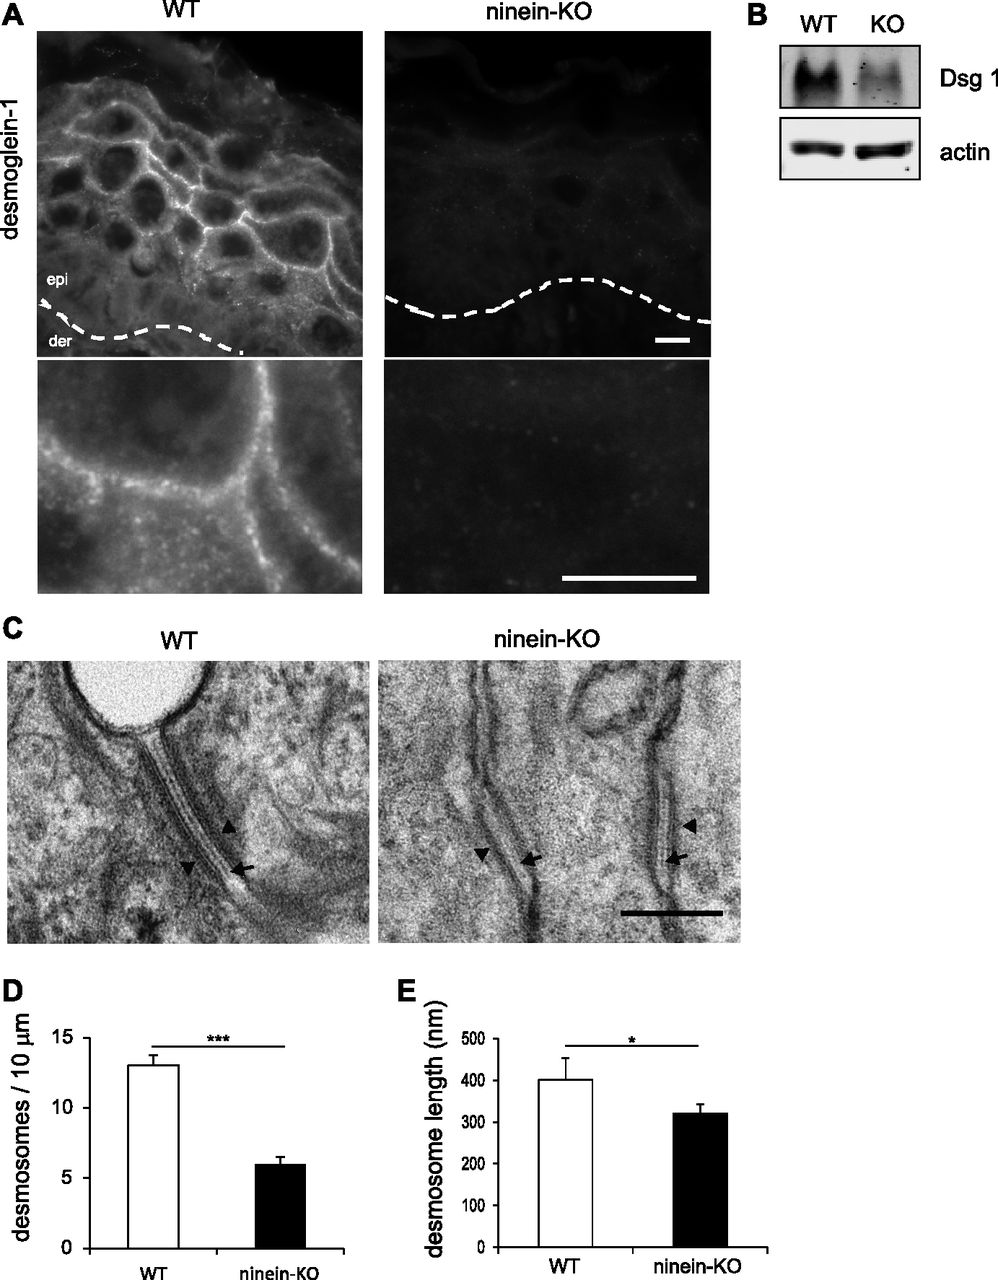
- Figure 5. Lack of ninein reduces the number of desmosomes and alters their structure in the suprabasal epidermis.
(A) Sections of epidermis from WT or ninein-KO newborn mice were stained with an antibody against desmoglein-1. The dotted line represents the interface between dermis (der) and epidermis (epi). Enlarged areas below show the continuous immunostaining of desmoglein-1 in WT controls, in contrast to the faint, discontinuous staining in ninein-KO epidermis. (B) Proteins were extracted from the epidermis of WT or ninein-KO newborn mice and probed by Western blotting with antibodies against desmoglein-1 and against actin as a loading control. (C) Electron microscopy of desmosomes in the epidermis of WT or ninein-KO newborn mice. Cell–cell contacts in the granular layer are shown. The arrowheads and arrows point to attachment plaques and desmosome dense midlines, respectively. (D) Number of desmosomes counted along 10 μm of cell–cell interface of WT and ninein-KO newborn suprabasal epidermis (error bars, SEM; at least 10 regions of 10 μm were analyzed, from four embryos from two independent matings; ****P < 0.0001). (E) Desmosome length was measured in WT and ninein-KO suprabasal epidermis, as presented in (C) (error bars, SEM; at least 15 desmosomes were measured from four embryos, two independent matings; *P < 0.05). Bars (A), 10 μm; (C) 200 nm.
- Figure S5. The absence of ninein provokes subtle defects in desmosome assembly.
(A) Sections of epidermis from WT and ninein-KO newborn mice were stained with antibodies (green) against β-catenin, claudin-1, desmoplakin, desmoglein-3, or plakoglobin. Blue, DNA. The dotted line represents the interface between dermis and epidermis; asterisks indicate nonspecific staining of the stratum corneum. (B) Immunofluorescence of ninein (red) and desmoplakin (green) in MPEK, transfected with control RNA or ninein-siRNA. Blue, DNA. Differentiation was induced by the addition of Ca2+, 30 min before fixation. (C) Percentage of cells as shown in (B), showing discontinuous cortical localization of desmoplakin (error bars, SEM; at least 1,000 cells were counted from six independent experiments; ****P < 0.001). (D) Electron microscopy of a desmosome in the epidermis of a ninein-cKO newborn mouse. In comparison with WT desmosomes, the desmoglea appears fuzzy and irregular, as also seen in constitutive ninein-KO (see Fig 5C). (E) Electron microscopy of epidermis at the interface between stratum granulosum and stratum corneum, from a ninein-cKO newborn mouse. Arrowheads indicate lamellar bodies at sites of secretion. In comparison with WT, the number of sites is decreased, as seen in constitutive ninein-KO (see Fig 6D). Bars (A, B), 10 μm; (D) 200 nm; (E) 1 μm.
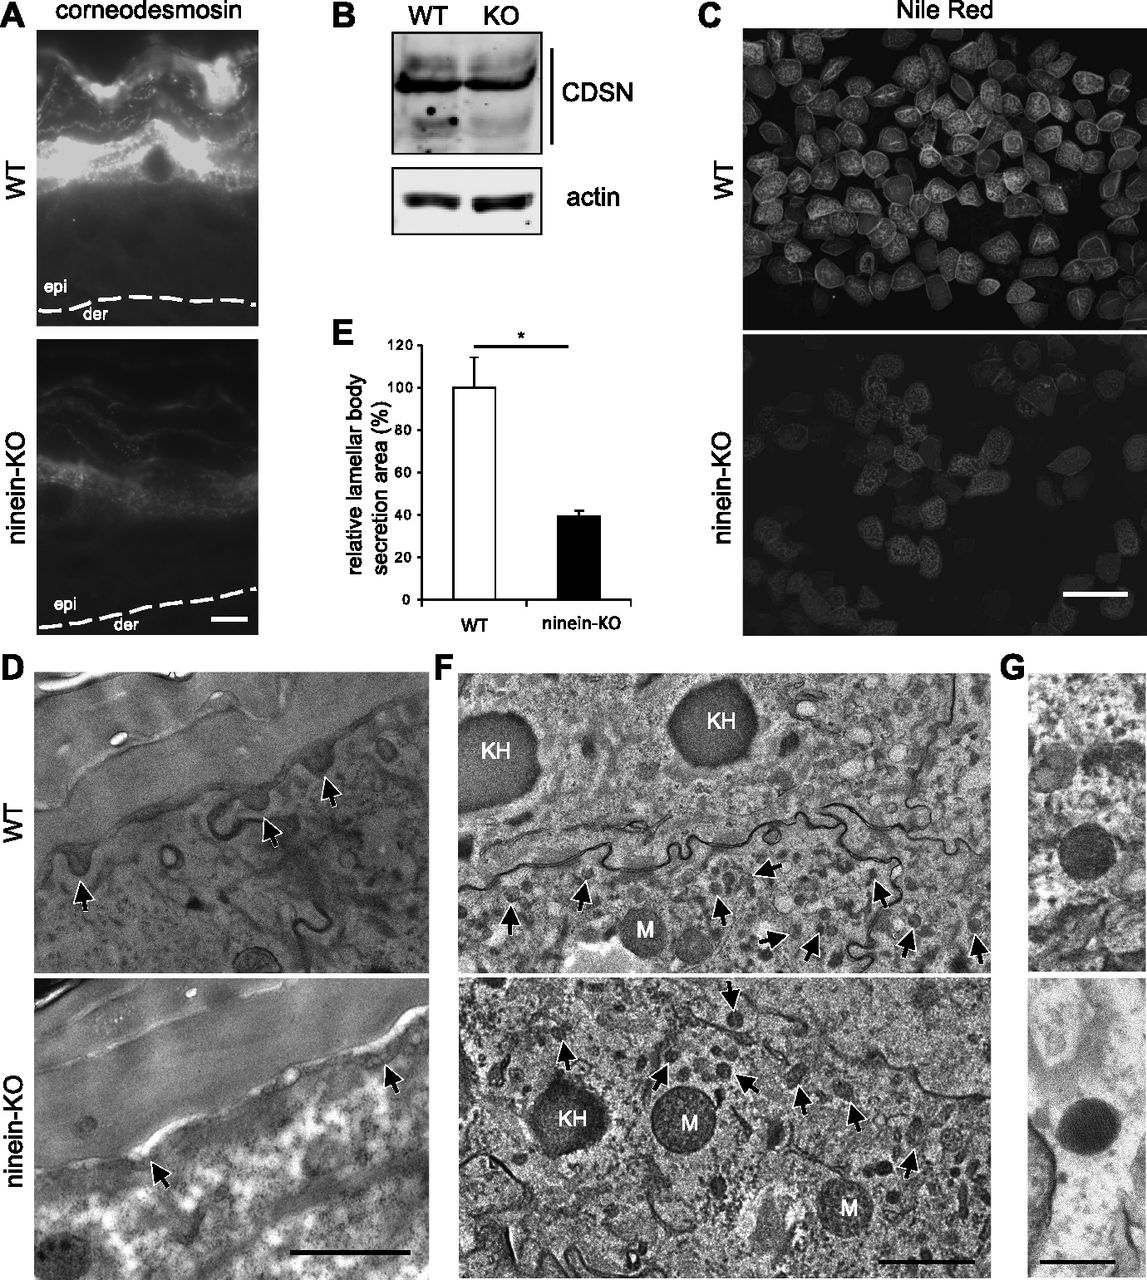
- Figure 6. Lack of ninein impairs secretion of lamellar bodies.
(A) Sections of epidermis from WT or ninein-KO newborn mice were stained with an antibody against corneodesmosin. The dotted line represents the interface between dermis (der) and epidermis (epi). (B) Proteins were extracted from the epidermis of WT or ninein-KO newborn mice, and probed by Western blotting with antibodies against corneodesmosin and against actin as a loading control. Blots were from the same protein extracts as shown in Fig 5B, and the blot against actin is therefore identical. (C) Corneocytes from the epidermis of WT and ninein-KO newborn mice were isolated and stained with Nile red. (D) Electron microscopy of epidermis at the interface between stratum granulosum and stratum corneum, from WT or ninein-KO newborn mice. Arrowheads indicate lamellar bodies at sites of secretion. (E) Areas of lamellar body secretion, as shown in (D), were outlined and measured. The value for the WT was set to 100% (error bars, SEM; at least 20 secreted lamellar bodies were measured per embryo (n = 4 different embryos, from two independent matings; *P < 0.05). (F) Electron microscopy of epidermis from WT or ninein-KO newborn mice, showing cytoplasmic lamellar bodies (arrows) in the cells of the lower granular layer. Lamellar bodies can be distinguished by size from the larger mitochondria (M) and keratohyaline granules (KH). (G) The lamellar substructure of the lamellar bodies is visible in enlarged views. Bars (A), 10 μm; (C) 100 μm (D, F), 1 μm; (G) 200 nm.
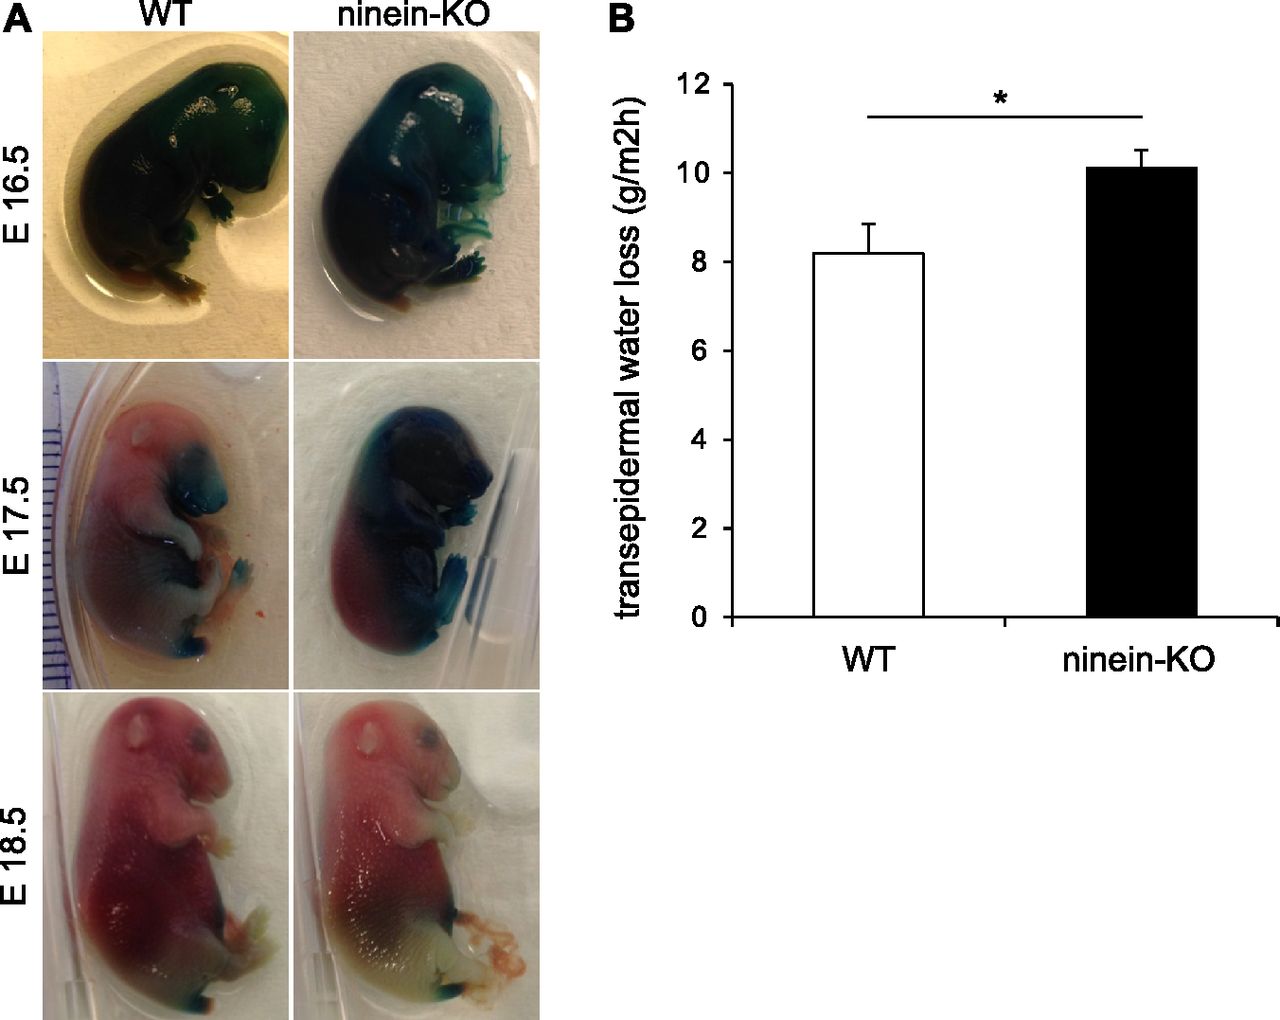
- Figure 7. Lack of ninein results in a defective epidermal barrier.
(A) Barrier assay (X-gal penetration) of WT and ninein-KO embryos at different embryonic stages, as indicated. (B) Measurements of TEWL were taken from WT and ninein-KO newborn mice (error bars, SEM; at least 26 newborns were analyzed, from six independent matings; *P < 0.05).
- Figure S6. Barrier defects in ninein-cKO epidermis.
Barrier assay (X-gal penetration) of WT and ninein-cKO embryos at different embryonic stages, as indicated. WT images are identical to those of Fig 7A.


In this Issue
Subjects
Related Articles
Cited By...
- No citing articles found.