


Article Figures & Data
Figures
- Figure S1. Conditional expression of BZLF1 in Raji cells.
(A) The conditional expression plasmid p4816 encodes the unmodified full-length BZLF1 (aa 1–245) protein. The conditional expression plasmids p5693 and p5694 encode FLAG- and tandem Strep-tagged full-length BZLF1 (aa 1–245) and the activation domain (AD) truncated BZLF1 (aa 175–236) protein also termed bZIP, respectively. The bicistronic coding sequences of the tetracycline-controlled repressor rTS and transactivator rtTA2S-M2 are shown. The addition of doxycycline induces bidirectional transcription and concomitant expression of three transgenes: enhanced GFP (eGFP), the human truncated NGF-receptor (tNGF-R), and BZLF1. An internal ribosomal entry site (IRES) separates tNGF-R and eGFP. β-lactamase (amp) and puromycin N-acetyl-transferase (puro) serve as resistance genes in bacteria and Raji cells, respectively. DNA replication in E. coli initiates at the prokaryotic origin of replication (ori). Epstein–Barr nuclear antigen 1 (EBNA1) binds to the origin of plasmid replication (oriP) and supports extrachromosomal DNA replication of the plasmids in Raji cells. (B) The conditional expression plasmids (p4816, p5693, and p5694) were stably introduced into Raji cells, and single-cell clones were selected by limiting dilution, expanded, and analyzed further. GFP expression in Raji cells was a measure of the induced expression of BZLF1. Upon addition of 100 ng/ml doxycycline to the cells for 15 h, GFP expression was analyzed by flow cytometry.
- Figure 1. BZLF1 expression precedes H3 loss at promoter sites of early lytic genes in lytically induced Raji cells.
(A) The kinetics of BZLF1 protein expression in parental Raji cells and Raji p4816 cells was analyzed by immunoblotting (IB) with a BZLF1-specific antibody (top panel) at the indicated time points (hours post induction). Immunodetection of tubulin (bottom panel) served as loading control. (B) ChIP directed against histone H3 (#1791; Abcam) of lytically induced Raji p4816 cells at the indicated time points of induction. Mean and SD from three independent experiments are shown. Primer information can be found in Table S2.
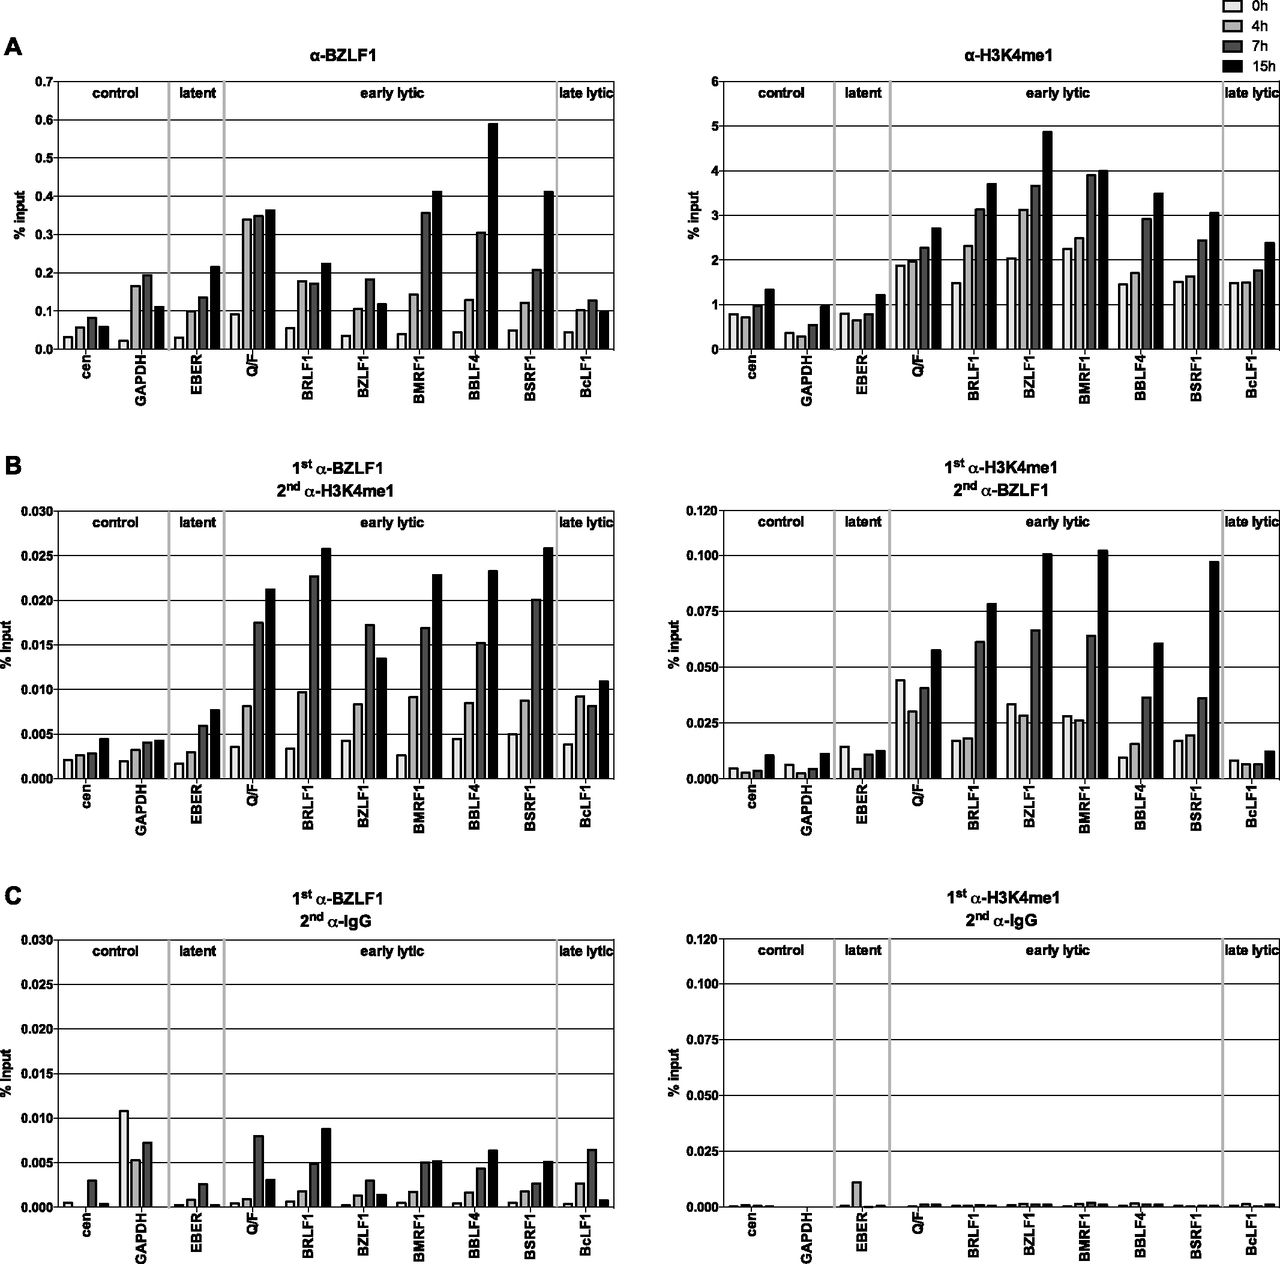
- Figure 2. BZLF1 and histone octamers co-occupy promoter sites of early lytic genes in vivo.
(A) qPCR data of ChIP experiments with Raji p4816 cells are shown. Antibodies directed against BZLF1 or H3K4me1, and primer pairs specific for the indicated human (cen, GAPDH) or viral loci were used. Primer information can be found in Table S2. Mean values of three independent experiments are provided. (B) As panel A, but ReChIP experiments with sequential use of two different antibodies against either BZLF1 or H3K4me1. Right and left panel differ in the order of the antibodies used (indicated on top of the panels). Mean values of qPCR analysis of three independent ChIP replicates are provided. (C) As panel B, but with nonspecific IgG antibody as secondary antibody (indicated on top of the panels).
- Figure S2. BZLF1 and histone octamers co-occupy promoter sites of early lytic genes in vivo.
(A, B) qPCR data of three individual ChIP experiments (roman numerals) are shown that were obtained with antibodies directed against BZLF1 (A) or H3K4me1 (B) and primer pairs specific for the indicated human (cen, GAPDH) or viral loci. Primers are listed in Table S2. (C, D) ReChIP experiments with the two different antibodies directed against either BZLF1 or H3K4me1 in different sequential orders as indicated on top of the panels.
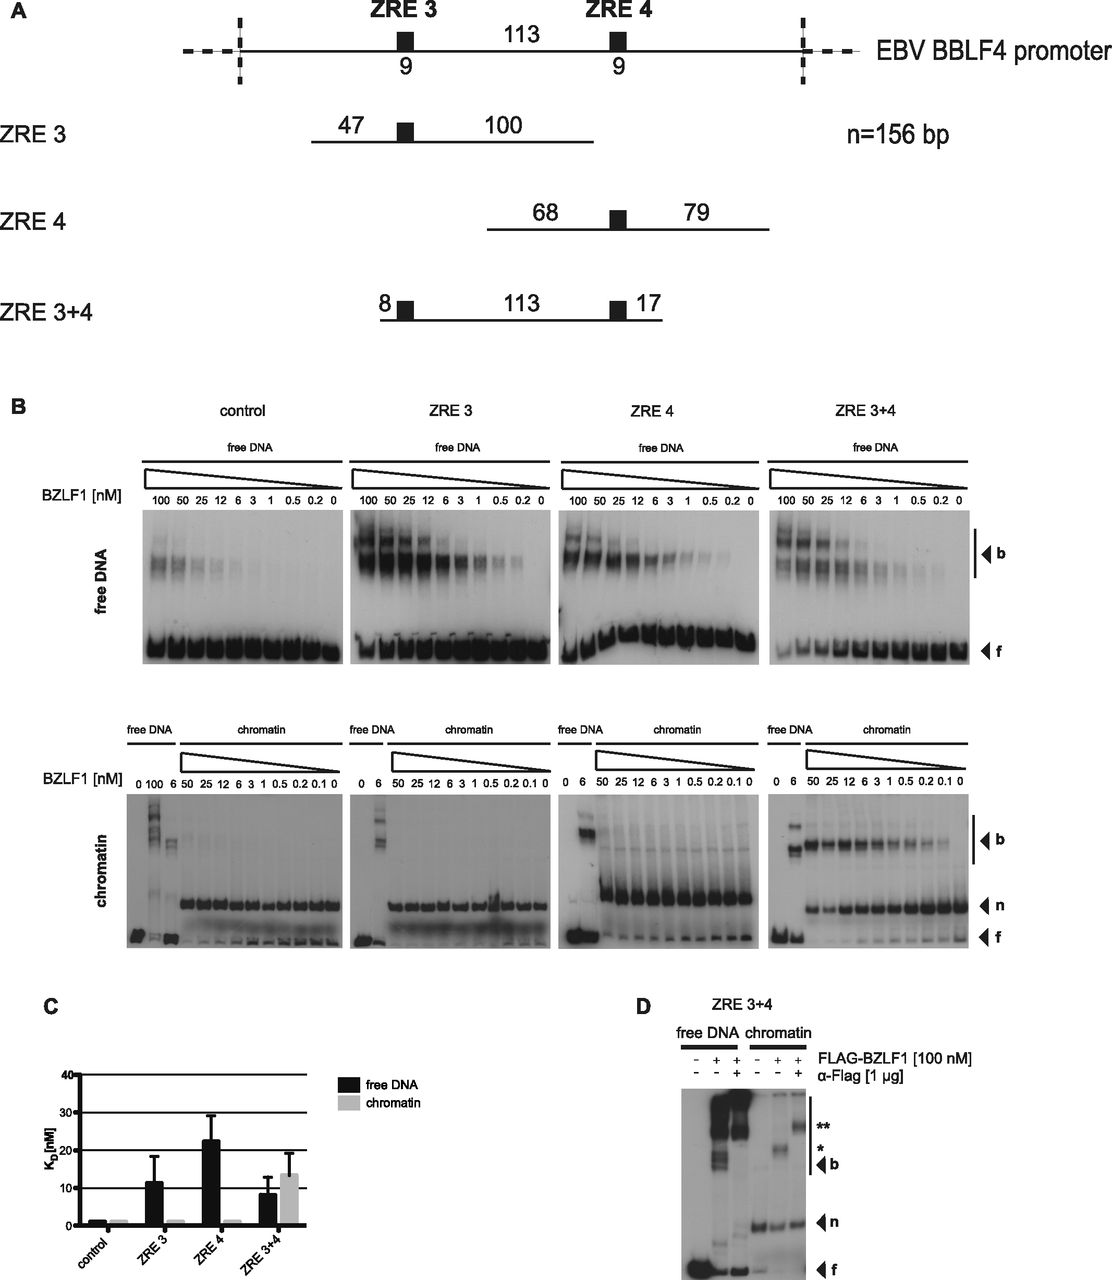
- Figure 3. BZLF1 binds mononucleosomes in vitro.
(A) Top: schematics of the relative position of the two BZLF1-responsive elements ZRE 3 and ZRE 4 (black boxes) at the BBLF4 promoter. Numbers indicate DNA lengths in bp. Below: schematics of three different 156-bp fragments encompassing the indicated ZREs. Both ZREs contain a CpG motif that must be methylated for BZLF1 binding. (B) EMSAs for binding of BZLF1 (at indicated concentration) to DNA fragments as in panel A or to an EBV control region without ZRE that is not bound by BZLF1. DNA was either free or assembled into mononucleosomes by salt gradient dialysis (chromatin). The migration positions of free DNA (f), mononucleosomes (n), or the complexes with BZLF1 (b) are indicated on the right of the autoradiographs. (C) Quantification of equilibrium dissociation constants (KD) from EMSA experiments as in panel B. If error bars are provided, the average and SD of three independent experiments are shown. (D) EMSA (“super shift assay”) with FLAG-tagged BZLF1 (FLAG-BZLF1), free or mononucleosomal ZRE 3+4 DNA and anti-FLAG (α-FLAG) antibody as indicated. The migration positions of the FLAG-BZLF1/mononucleosome and the FLAG-BZLF1/α-FLAG/mononucleosome complexes are indicated on the right by one (*) and two asterisks (**), respectively.
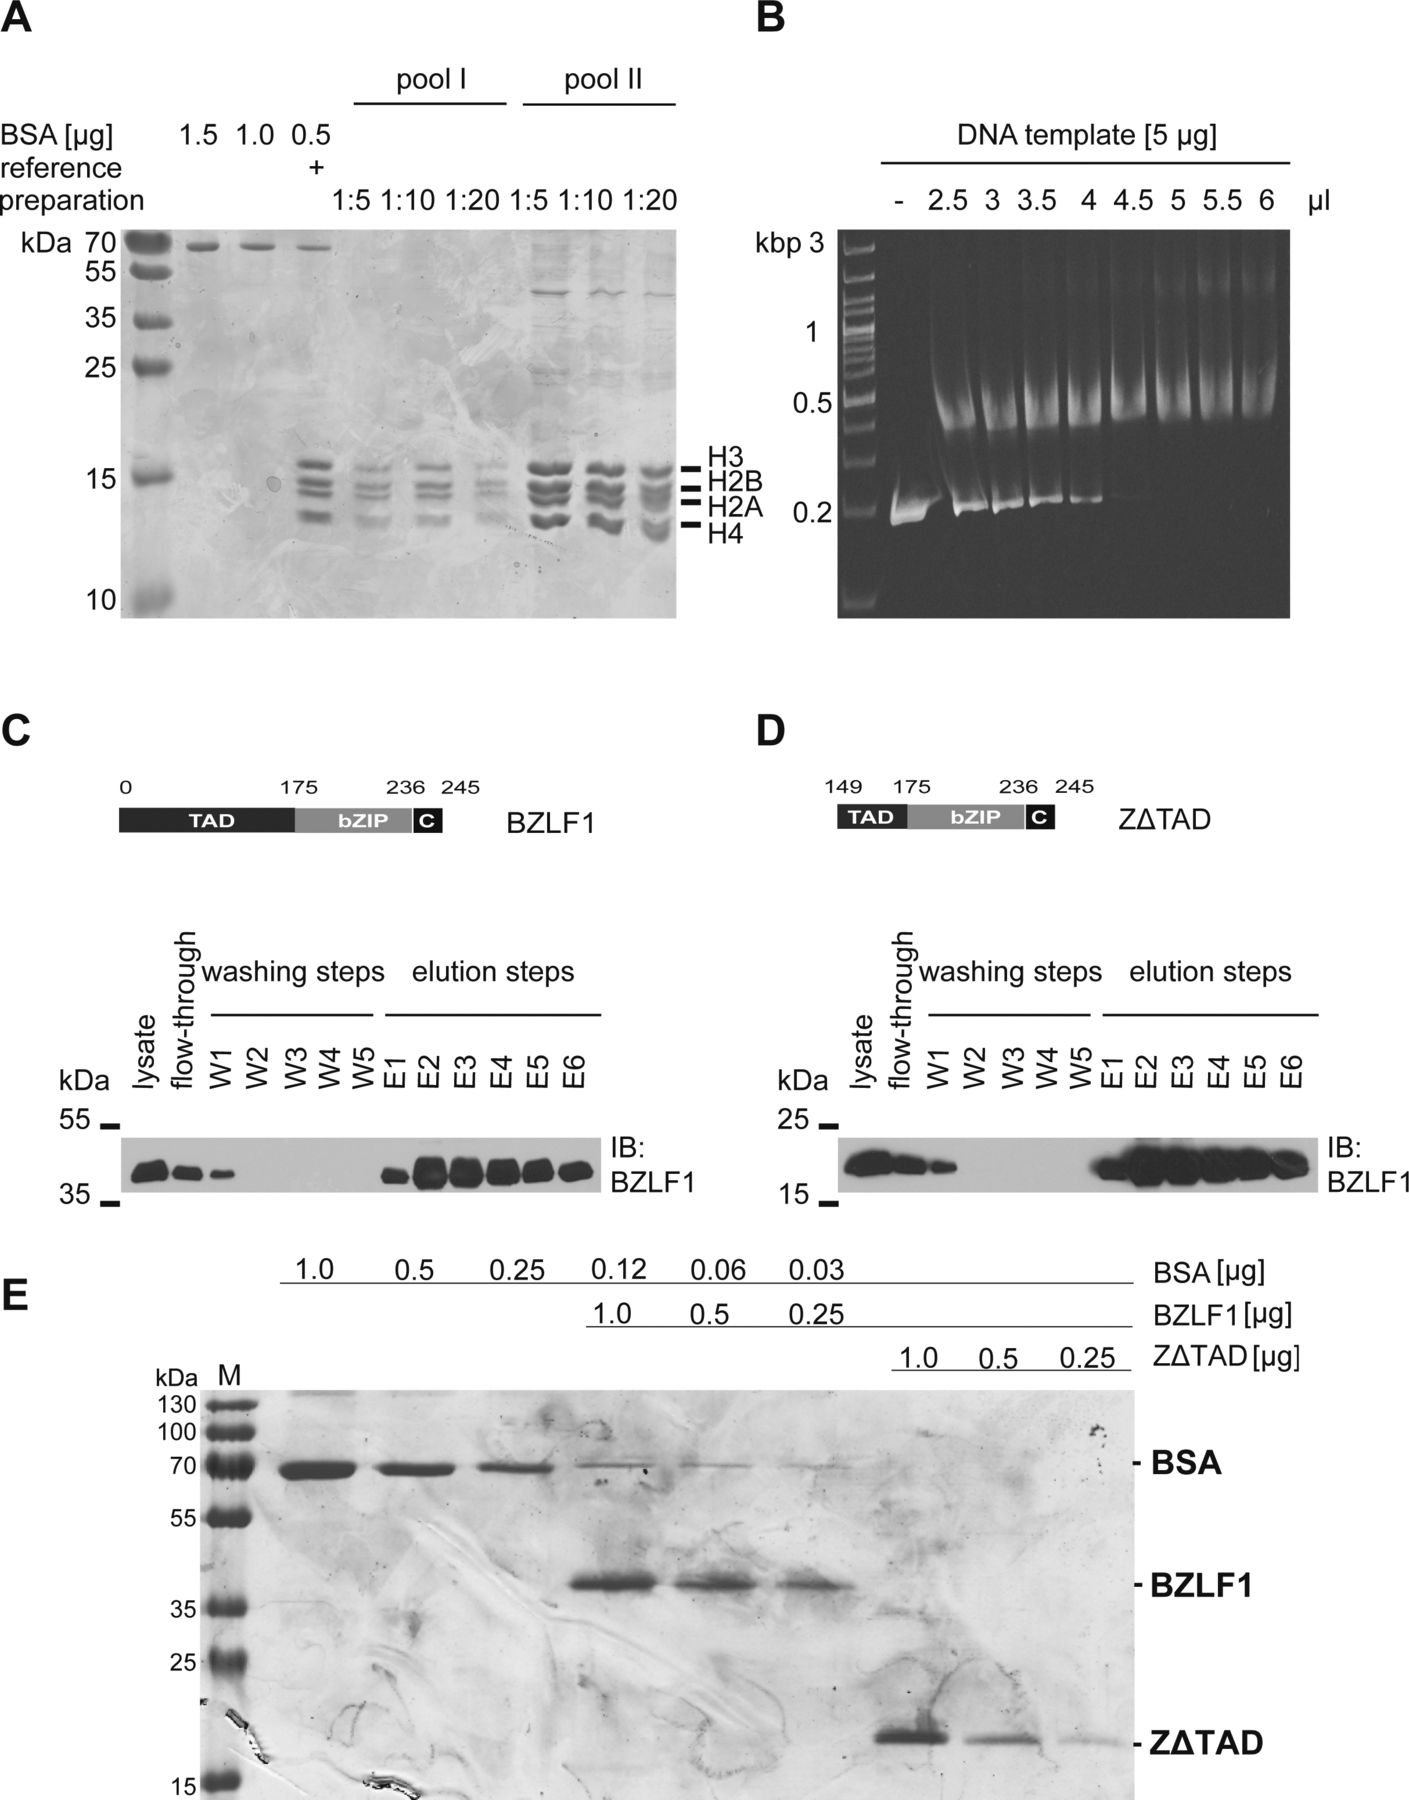
- Figure S3. Histone octamer preparation, chromatin assembly, and BZLF1 protein purification.
The preparation of histone octamers from Drosophila embryos and the chromatin assembly after salt gradient dialysis were performed according to Krietenstein et al (2012). (A) Two histone octamer preparations were analyzed on Coomassie blue–stained SDS–PAGE gels and showed the correct ratio of all four histones (1:1:1:1) in the histone octamer. The concentrations of the histone octamer preparations were estimated with the aid of serial dilutions of BSA and a reference histone preparation. (B) The ethidium bromide–stained agarose gel illustrates the titrated assembly of mononucleosomal chromatin with a DNA template (ZRE 3+4) and Drosophila histone octamers by salt gradient dialysis. 4.5 μl of histone octamer pool II, diluted 1:2, and 5 μg of DNA were used for the assembly of mononucleosomal DNA templates in all subsequent experiments. (C, D) Expression plasmids encoding BZLF1 aa 1–245 (C) and its truncated version BZLF1 aa 149–245 (ZΔTAD) (D) were transiently transfected into HEK293 cells, and the native BZLF1 proteins were purified to be used in EMSAs. Shown are the modular structures of the BZLF1 proteins, numbers indicate amino acid residues. BZLF1 and ZΔTAD are expressed as FLAG- and tandem Strep-tagged proteins. The Western blots show the results after the different steps along the Strep-tag purification process (lysate preparation, flow-through check, washing, and elution steps) of Strep-tag fusion proteins by immunodetection using an anti-BZLF1 antibody. (E) Coomassie staining after SDS–PAGE shows the quality of purified BZLF1 and ZΔTAD proteins and estimates their concentrations as compared with serial dilutions of BSA.
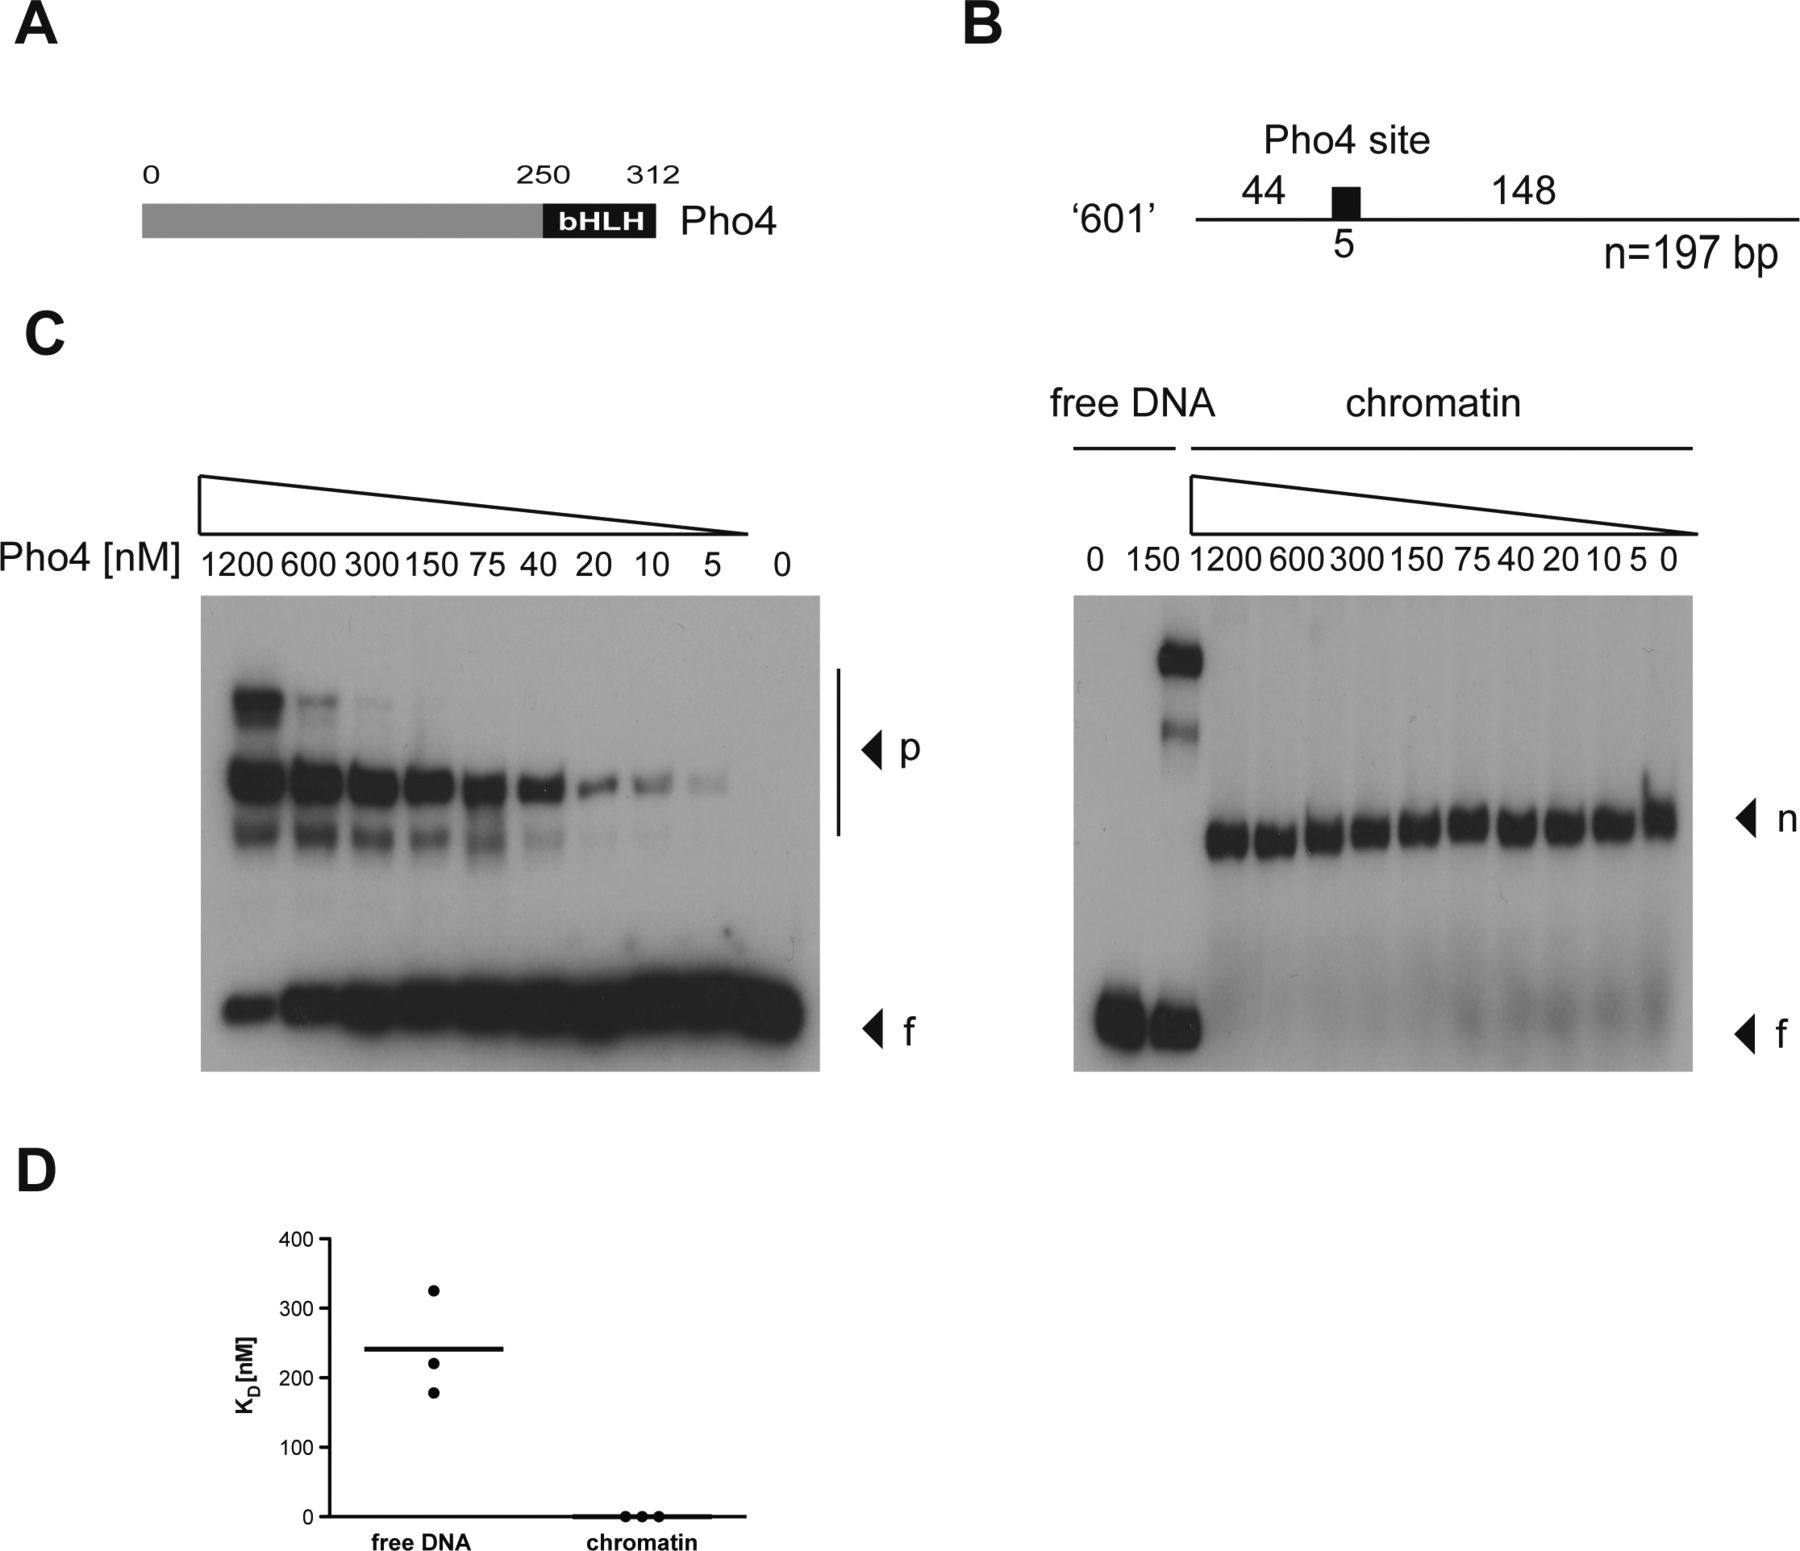
- Figure S4. The transcription factor Pho4 does not bind nucleosomal DNA in vitro.
(A) Shown is the modular structure of Pho4 with its basic helix-loop-helix (bHLH) domain. (B) Nucleosomal positioning sequence “601” (Lowary & Widom, 1998) is shown, which contains a single Pho4-binding site of 5 bp as indicated. (C) Left and right panels show the interaction of Pho4 protein with free (f) and mononucleosomal “601” DNA (n), respectively. Complexes with Pho4 (p) are indicated. (D) Pho4’s equilibrium dissociation constant (KD) was determined with free and mononucleosomal DNA in three independent experiments. The KD with free DNA was 240 nM on average, and Pho4 did not bind the mononucleosomal DNA.
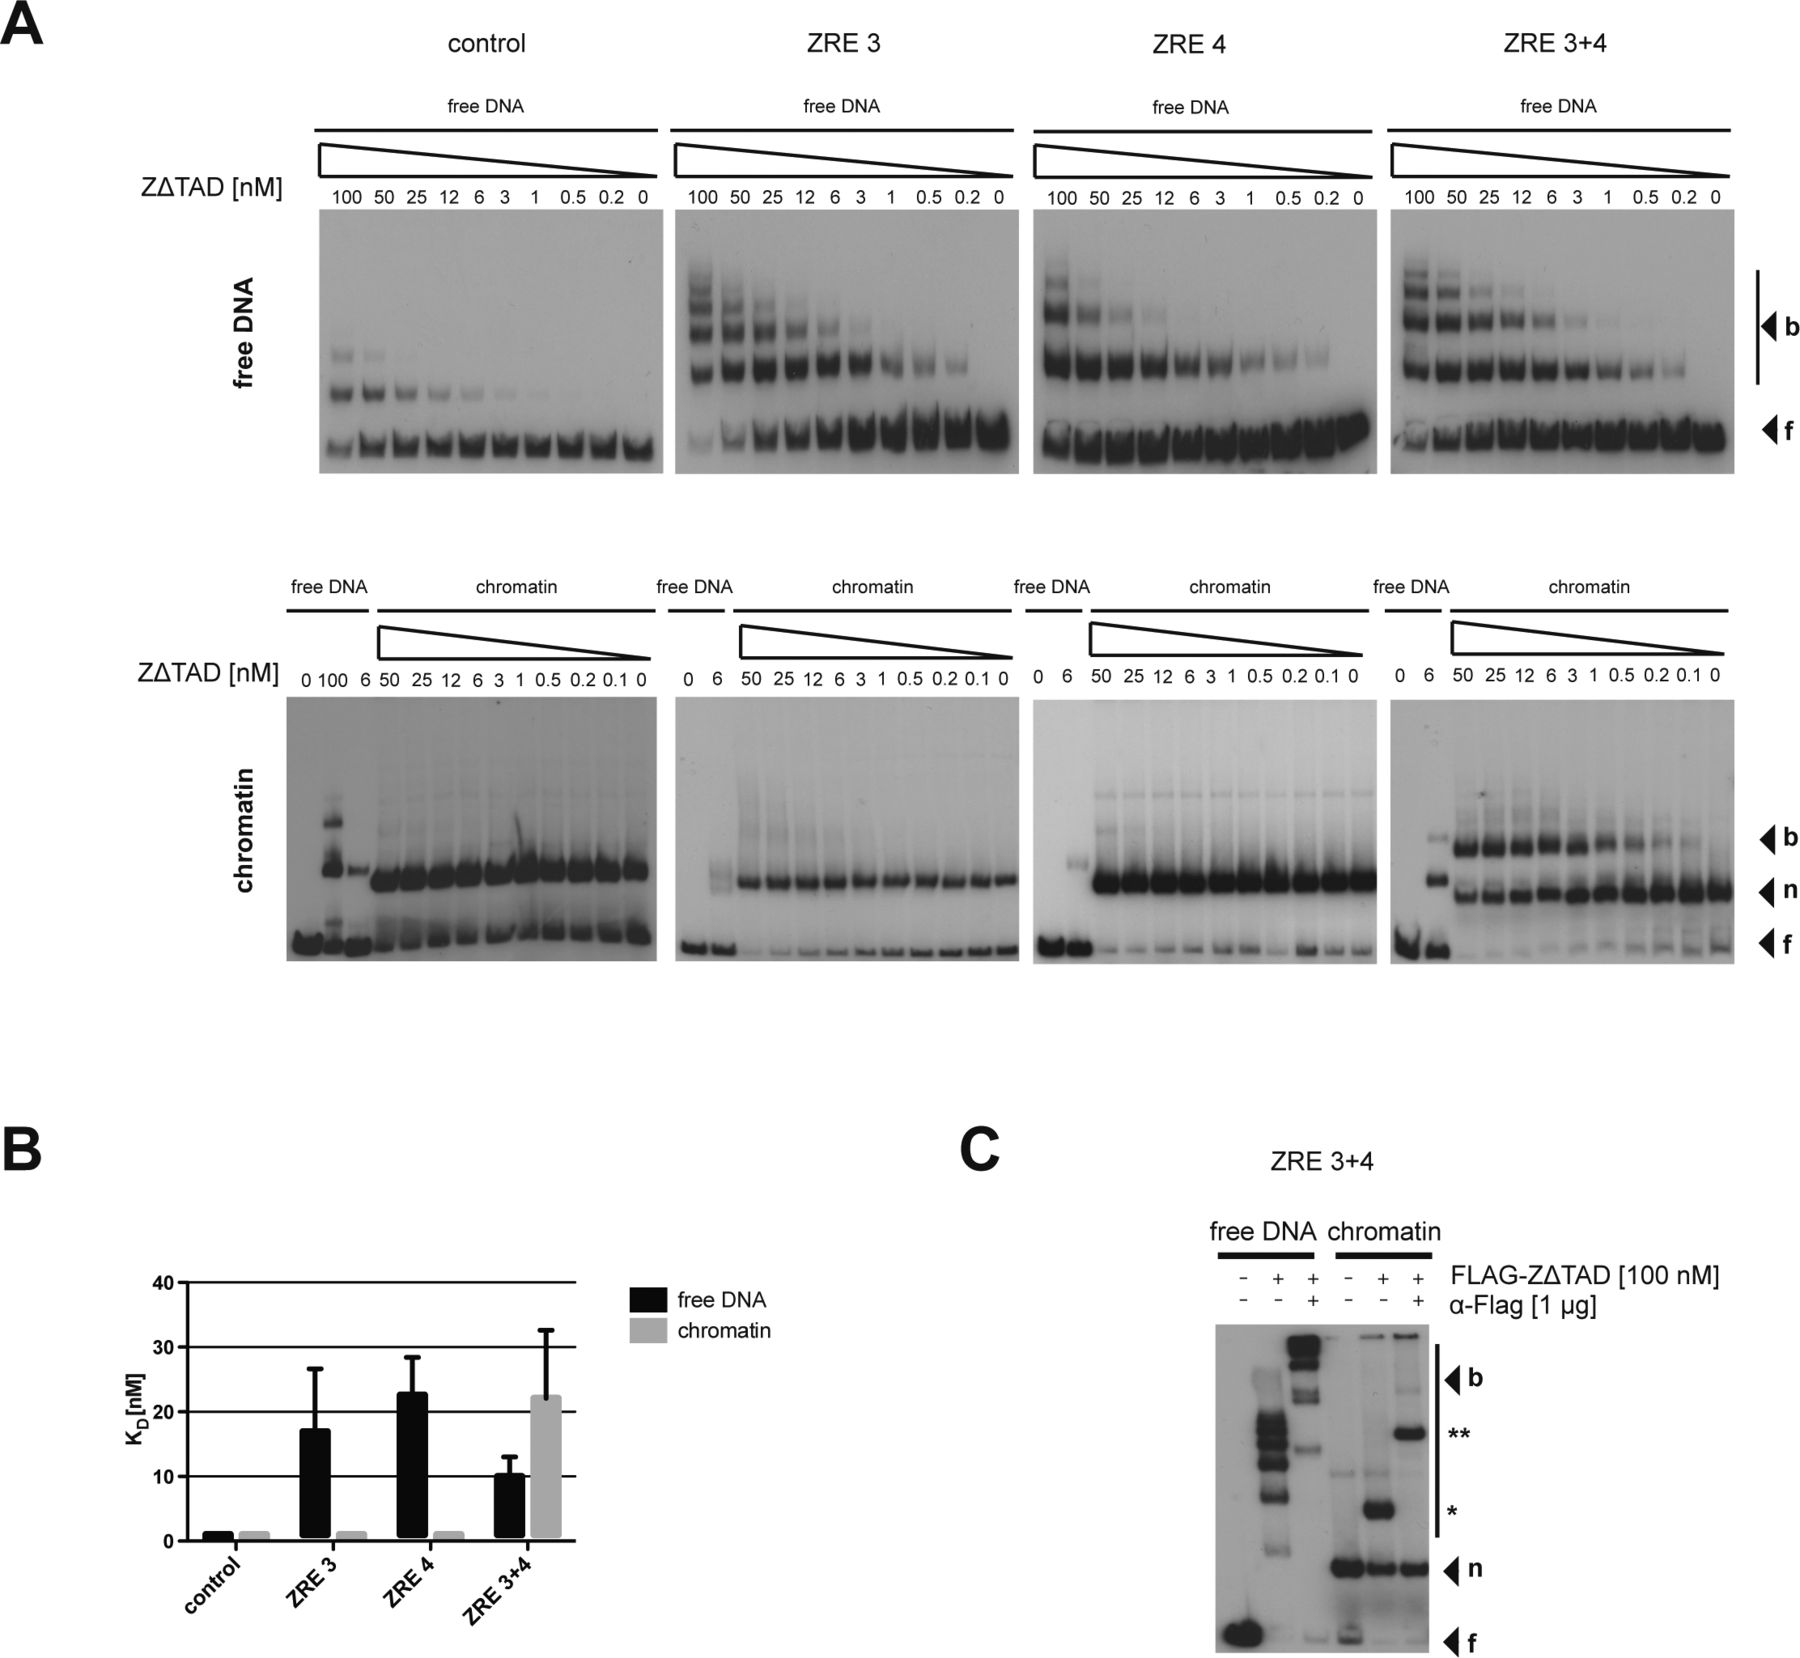
- Figure S5. Truncated BZLF1 ZΔTAD binds mononucleosomes in vitro.
(A) In vitro binding of BZLF1 aa149-245 (ZΔTAD) to the four different 156-bp DNAs as in Fig 3A are shown. Upper and lower rows of panels show free DNA or mononucleosomes (f, free DNA; n, mononucleosomal DNA; and b, complex of ZΔTAD with free or mononucleosomal DNA). An EBV control region, which lacks a ZRE motif and is not bound by BZLF1 served as a negative control. ZΔTAD binding to free DNA containing only one or two ZREs did not differ much. The negative control showed hardly any interaction with the truncated BZLF1 version. ZΔTAD did not bind to mononucleosomal DNA templates containing only one ZRE but did interact with the DNA template with two ZRE motifs, ZRE 3+4. (B) Summary of the equilibrium dissociation constant (KD) values of three independent EMSA with ZΔTAD protein and free or mononucleosomal DNA. The KD values of all free DNA templates and the ZRE 3+4 mononucleosomes are similar. (C) ZΔTAD super shift assay with free and mononucleosomal ZRE 3+4 DNA. ZΔTAD binds to the mononucleosomal DNA template as indicated by a slowly migrating shift band (*). Addition of an α-FLAG antibody caused the complex (**) to migrate even more slowly.
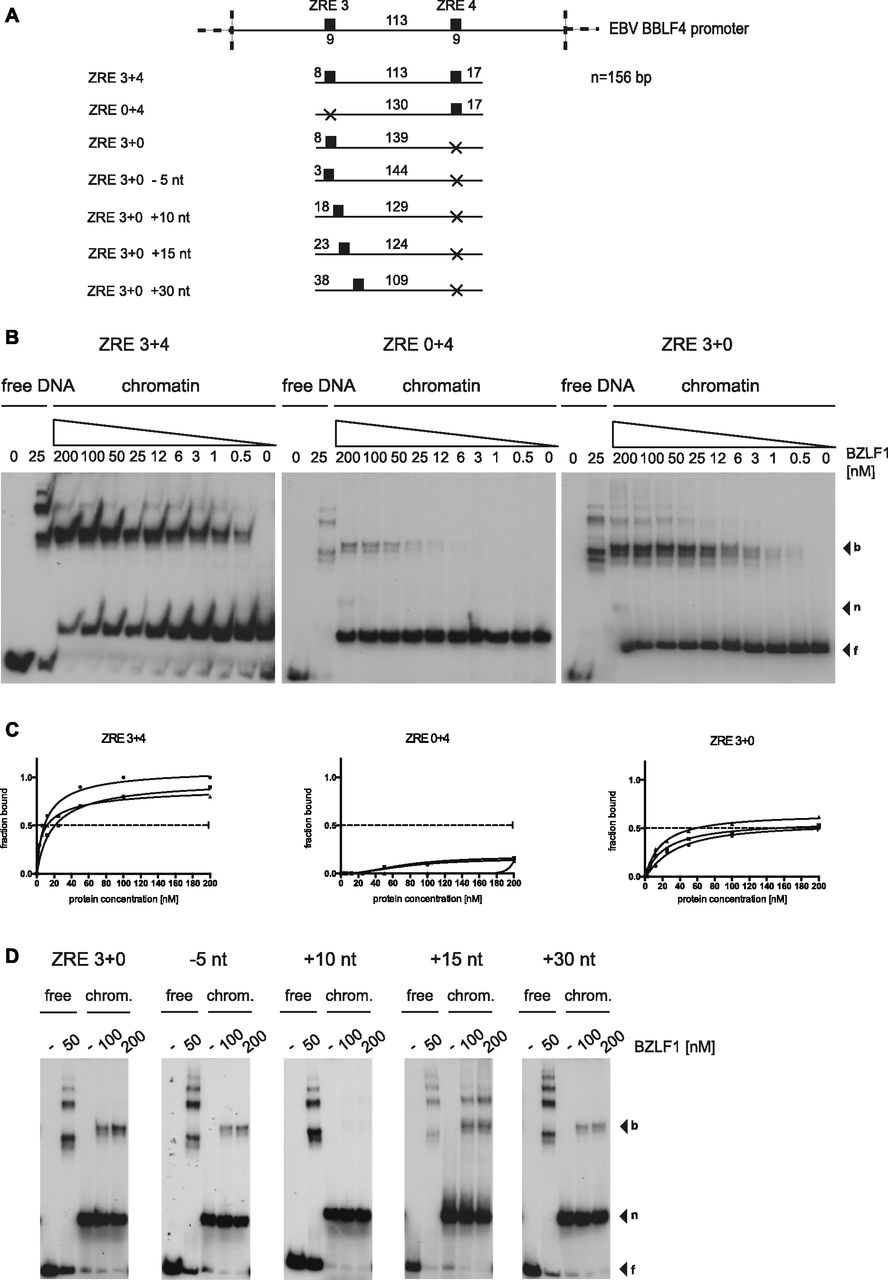
- Figure 4. BZLF1 shows cooperative binding to the nucleosomal core in vitro.
(A) Shown are the DNA templates used for the functional analysis of the two BZLF1-responsive elements ZRE 3 and ZRE 4 in the promoter of BBLF4 as in Fig 3A. (B) EMSA results of BZLF1 and the DNA templates ZRE 3+4, ZRE 0+4, and ZRE 3+0 suggested a cooperative binding of BZLF1 to ZRE 3 and ZRE 4. The ZRE 3+4 template was robustly bound by BZLF1, which interacted less efficiently with ZRE 3+0 and barely with ZRE 0+4. (C) Individual Hill slope curves of BZLF1 binding to the mononucleosomal DNA templates ZRE 3+4, ZRE 0+4, and ZRE 3+0 show the result of three independent experiments. (D) The position of the ZRE 3 motif within the DNA template ZRE 3+0 was altered as illustrated in (A). BZLF1 was competent to bind its ZRE 3 site in two more proximal positions (ZRE +15 nt and +30 nt) within the nucleosomal core.
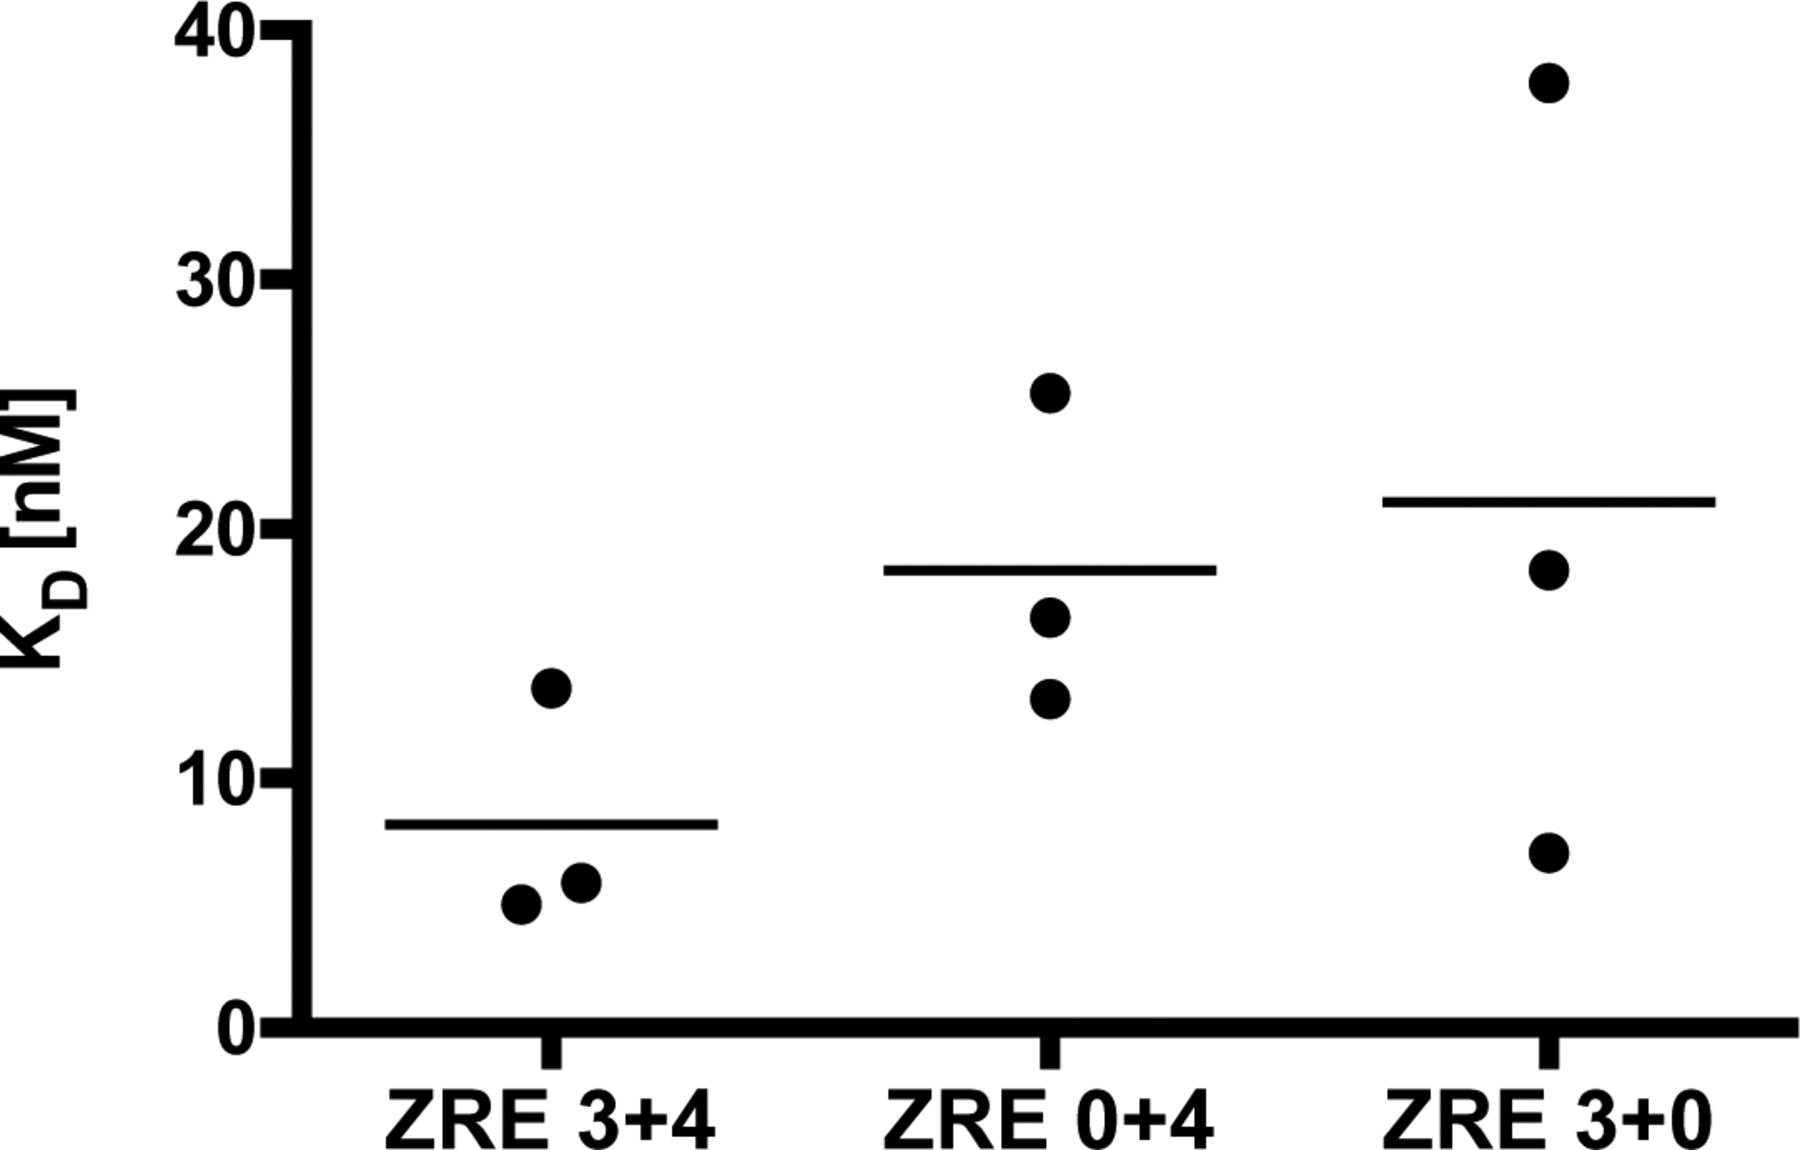
- Figure S6. BZLF1’s half maximum binding to the free ZRE 3+4, ZRE 0+4, and ZRE 3+0 DNAs in EMSAs.
KD values of BZLF1 with ZRE 3+4, ZRE 0+4, and ZRE 3+0 DNAs were 8 nM, 18 nM, and 22 nM, respectively.
- Figure 5. BZLF1 interacts with the core subunits of the cellular chromatin remodelers SNF2h and INO80 in vivo.
(A) Raji cell lines were stably transfected with tetracycline-regulated expression plasmids encoding Strep-tagged BZLF1 full-length or bZIP protein (Fig S1) consisting of aa 175 to aa 236 with the DNA-binding and dimerization domains of BZLF1. After treatment with benzonase and DNase I, the Strep-tag fusion proteins of lytically induced cells were captured with Streptavidin beads. Co-precipitated proteins were analyzed with antibodies directed against SNF2h, INO80, and CHD4. In the immunoblot detecting BZLF1 and bZIP (top panel), 0.5% of the total protein lysate was loaded as “input” per lane; in each of the two lanes labeled “IP:Strep,” 10% of the immunoprecipitated material was loaded. In the immunoblots detecting SNF2h, INO80, or CHD4, 1% of the total protein lysate was loaded as “input” per lane; in the lanes labeled “IP:Strep,” 90% of the immunoprecipitated material was loaded per lane. “o” indicates signals from proteolytic degradation. (B) Shown are the modular structures of truncated BZLF1 variants. TAD indicates the TAD of BZLF1. (C) Protein expression of the truncated BZLF1 variants (see panel B) in HEK293 cells was analyzed by immunodetection with the BZLF1-specific BZ1 antibody. (D) HEK293 cells were co-transfected with expression plasmids encoding BZLF1 variants and GFP-tagged chromatin remodeler ATPase subunits SNF2h or INO80. The cell lysates were treated with the enzymes benzonase and DNase I before immunoprecipitations of the GFP-tagged chromatin remodelers with GFP-binder beads. The analysis of input and immunoprecipitated material was performed by Western blot detection with the BZ1 antibody directed against BZLF1. “o” indicates signals from proteolytic degradation.
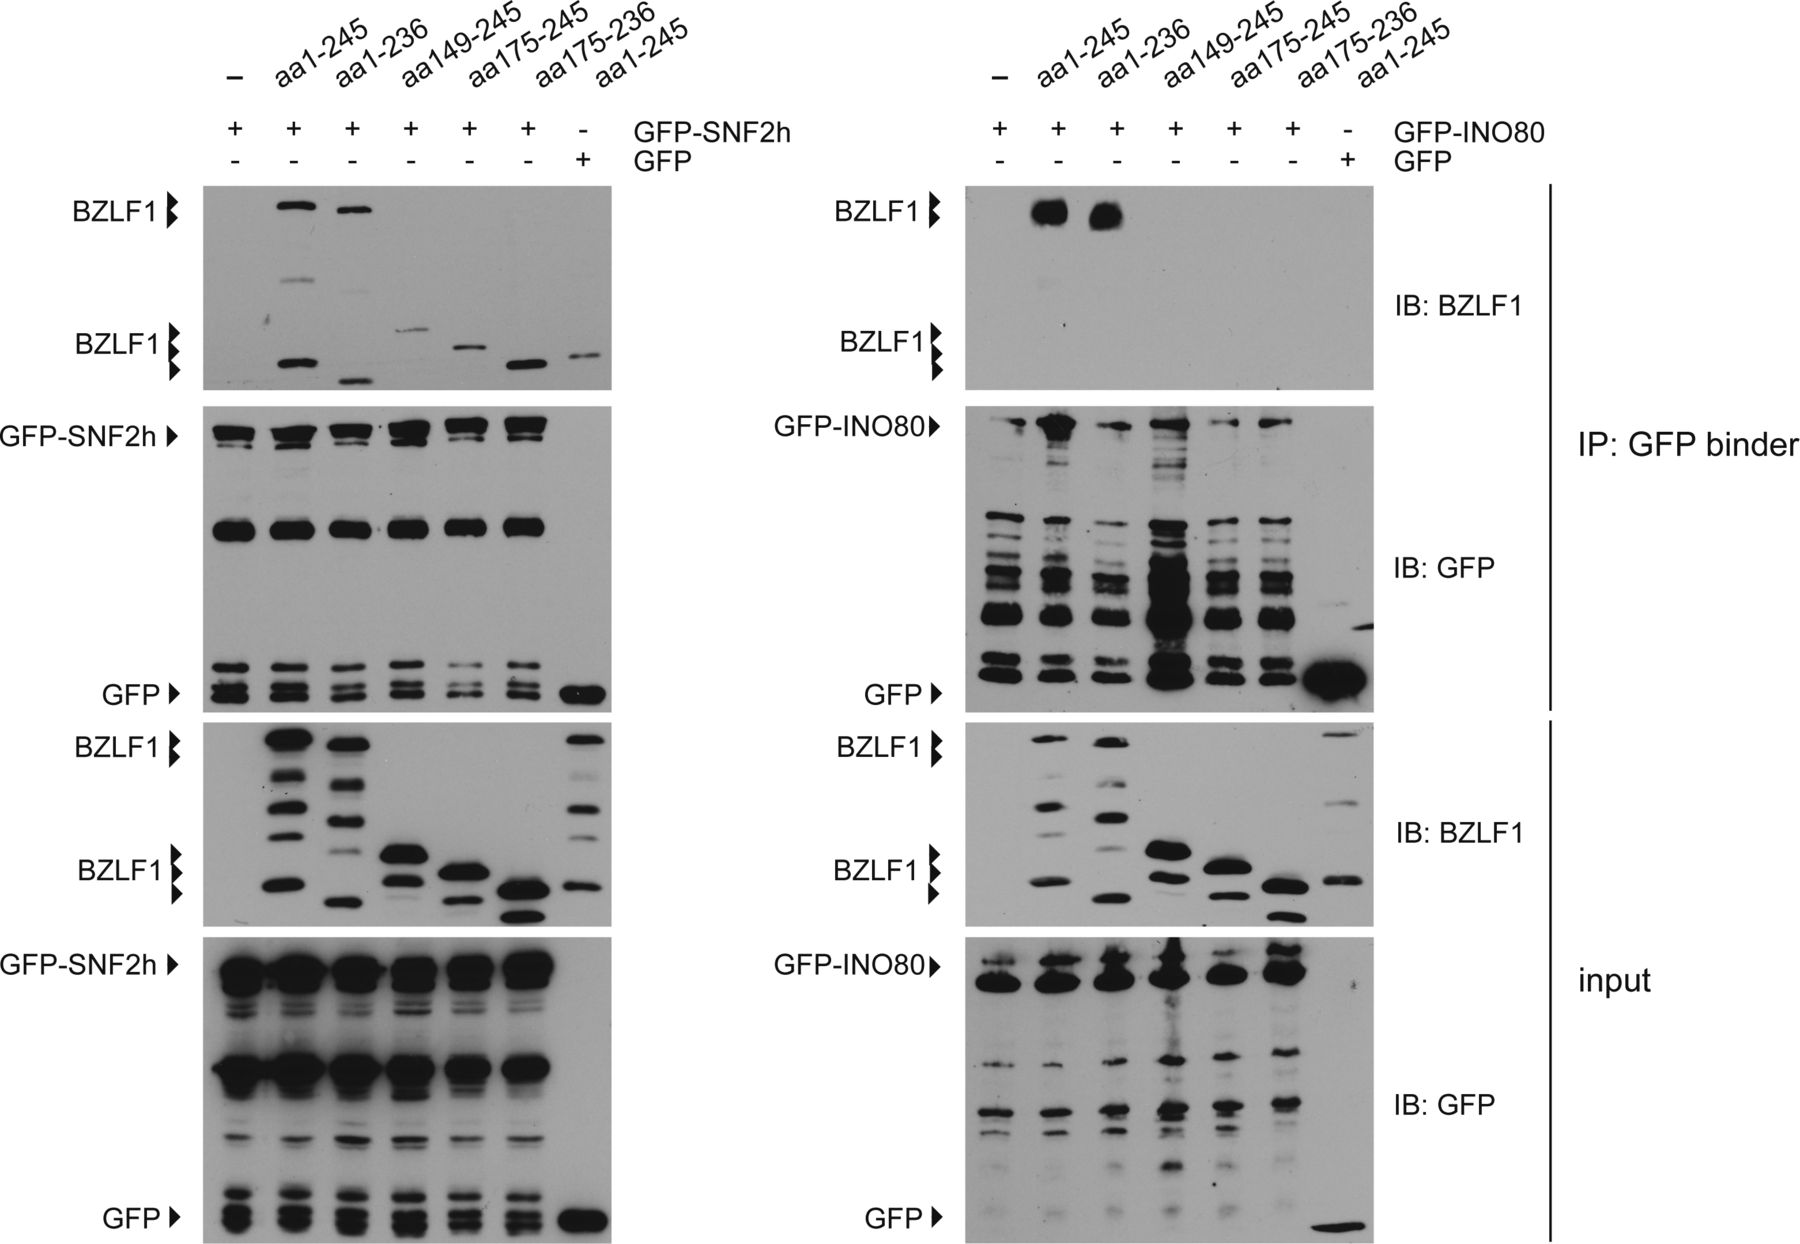
- Figure S7. Protein–protein interactions of the chromatin remodeler SNF2h and INO80 with the BZLF1 variants aa 1–245, aa 1–236, aa 149–245, aa 175–245, and aa 175–236 in HEK293 cells.
Immunoblots of input and precipitated proteins from immunoprecipitation experiments with antibodies directed against BZLF1 and GFP. Fig S7 complements Fig 5 in the main part of the manuscript.
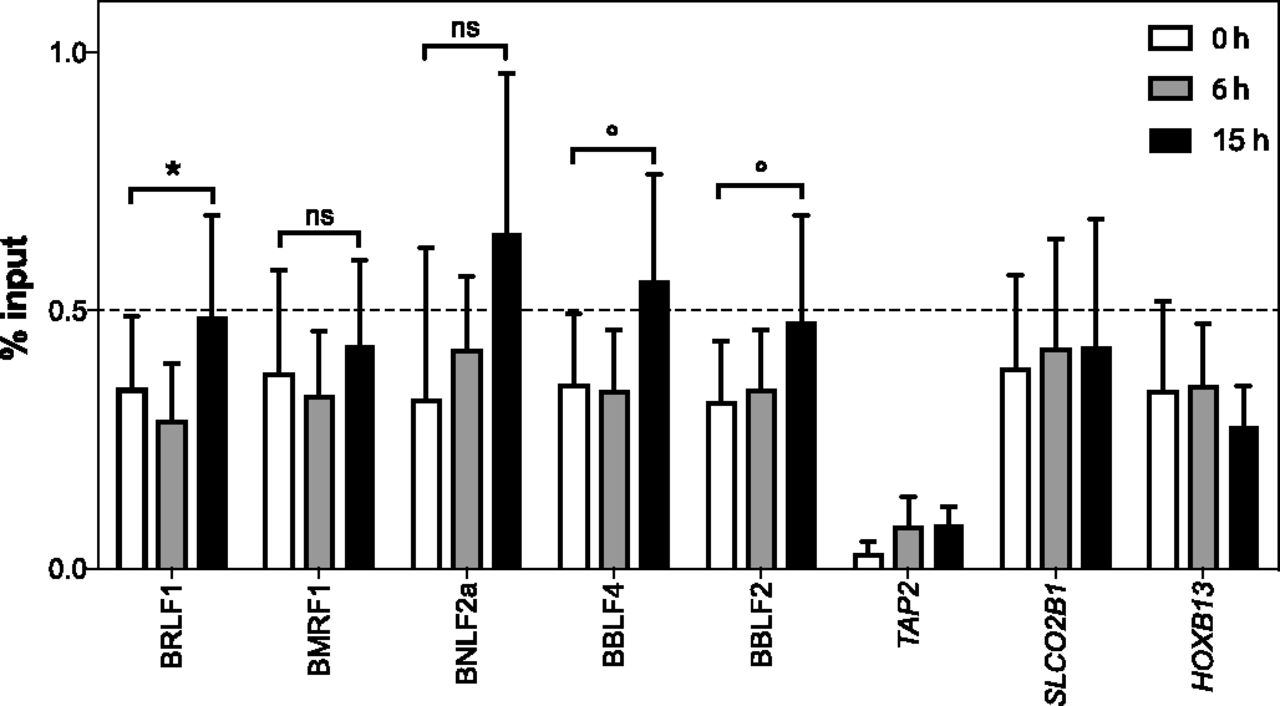
- Figure 6. INO80 is enriched at BZLF1-regulated early lytic EBV promoters.
Chromatin from Raji p4816 cells induced with doxycycline to initiate the expression of BZLF1 for 0, 6, or 15 h were used to perform ChIP experiments with an INO80 antibody. The recovered DNAs were quantified by qPCR with suitable primer pairs (Table S2). We compared the input versus ChIPed DNAs expressed as “% input.” Shown is the analysis of five different early lytic promoter regions. Three cellular loci, where BZLF1 does not bind, served as negative controls. Mean and SD values from four different experiments are provided. The results with non-induced (0 h) and induced (15 h) samples were analyzed with the paired t test, and significance levels were defined as *P < 0.05 and °P < 0.1; ns, not significant.
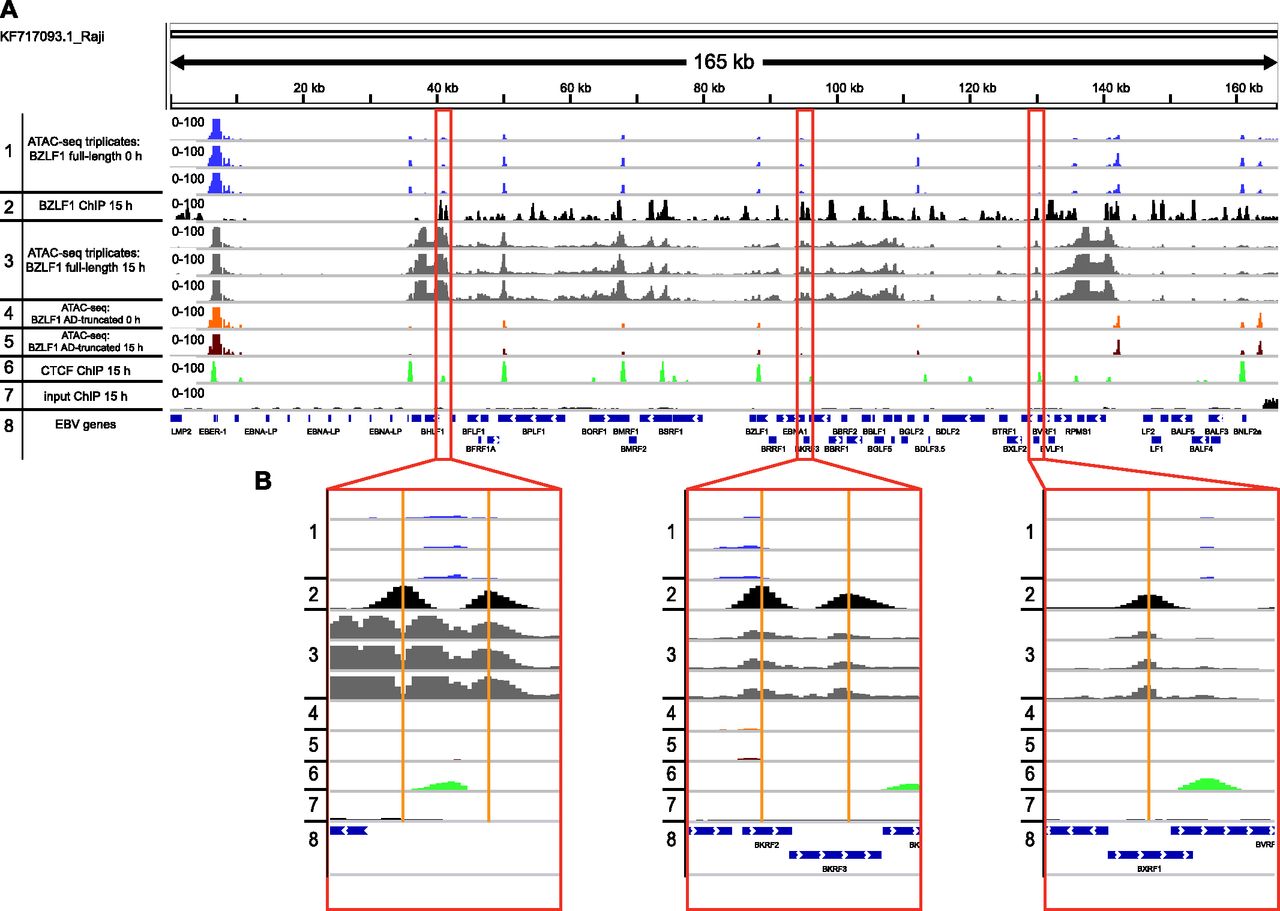
- Figure 7. EBV genome-wide ATAC-seq coverage in non-induced and induced Raji p4816 cells.
(A) The normalized coverage of three independent ATAC-seq experiments are shown in non-induced Raji p4816 cells (track 1) and cells induced for 15 h (track 3). The reads from six ATAC-seq experiments are aligned on the complete Raji EBV genome (KF717093.1) together with normalized ChIP-seq data obtained with BZLF1- or CTCF-specific antibodies (tracks 2 and 6, respectively). Additional controls include ATAC-seq reads from AD-truncated Raji cells before and after induction for 15 h (tracks 4 and 5, respectively), which do not differ and are indistinguishable from ATAC-seq reads found in non-induced Raji p4816 cells (track 1). The input control (track 7) pairs with ChIP-seq experiments at 15 h post induction shown in tracks 2 and 6 and indicate the low and even level of mappable reads before ChIP. Track 8 provides the positions of selected EBV genes in the 165-kb Raji genome. (B) The three panels provide individual examples of BZLF1 peaks in Raji cells that appear after doxycycline induction of full-length BZLF1 (track 2) and the concomitant increase in chromatin accessibility (track 3). The tracks are annotated according to tracks in panel A.
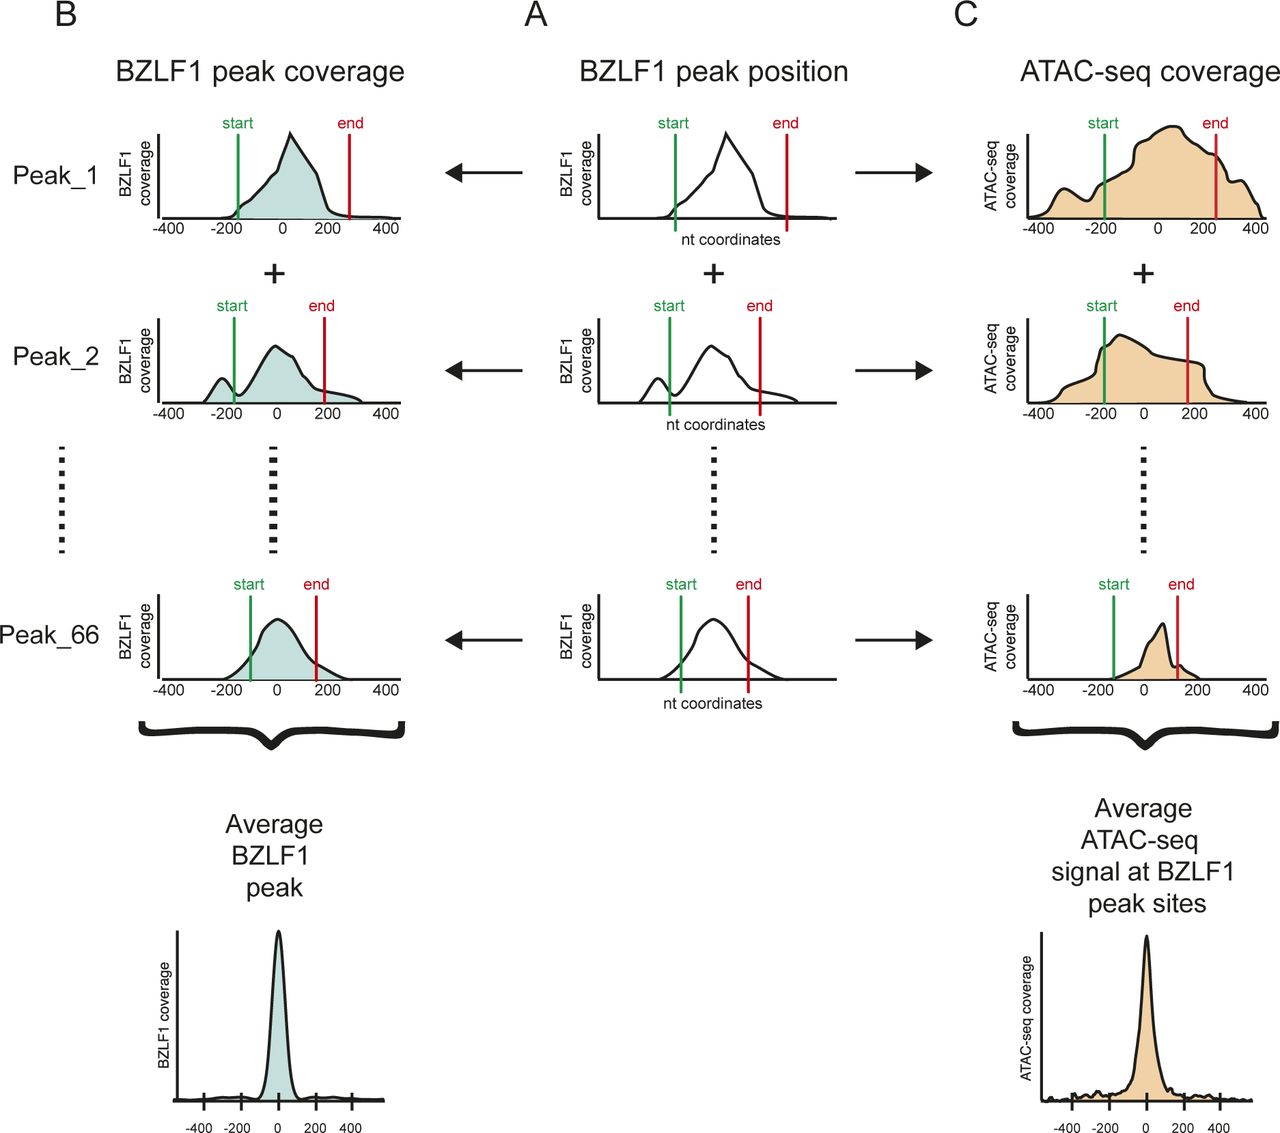
- Figure S8. Workflow of the identification of BZLF1 peaks and their alignment with ATAC-seq data.
The schematic overview represents the three main steps of the bioinformatic analysis. (A) ChIP-seq data with a BZLF1-specific antibody were obtained from doxycycline-induced Raji p4816 cell chromatin. Within the mapped ChIP-seq data, the peak caller MACS2 identified 67 BZLF1-specific peaks with their start (green) and end (red) nucleotide (nt) coordinates in Raji EBV DNA. Three BZLF1 peaks are schematically shown. (B) Metaplots covering individual peaks (three examples) and the mean average BZLF1 peak (bottom) were generated to cover a range of ±400 nt from the center of the BZLF1 peaks. (C) ATAC-seq data were aligned according to the called nt coordinates of the individual BZLF1 peaks as depicted in panel A. At the bottom, the metaplot shows the average coverage of the ATAC-seq data at all 67 identified BZLF1 peaks in Raji cell chromatin.
- Figure 8. ATAC-seq coverage at the 67 BZLF1-binding sites in Raji EBV chromatin.
(A) The panel shows the metaplot of the average ATAC-seq coverage at BZLF1 peaks in Raji EBV DNA. The plot covers a ±400-nt range centered at the maximal heights of 67 BZLF1 peaks identified by the MACS2 peak caller in ChIP-seq experiments with an antibody directed against BZLF1. Four ATAC-seq conditions are indicated comparing non-induced Raji p4816 cells (thin blue line; full-length, non-induced) and cells induced for 15 h (thick grey line; full-length, induced) as well as AD-truncated Raji cells before and after induction (thin red and brown lines; truncated, non-induced and induced, respectively). (B) The boxplot quantifies the average data shown in panel A. (C, D) The two heatmaps summarize the individual ATAC-seq coverage at the identified 67 BZLF1 ChIP-seq peaks in Raji EBV chromatin arranged in hierarchical order. The left (C) and right (D) panels illustrate the situation in non-induced Raji p4816 cells (full-length) and cells induced for 15 h (full-length), respectively. The data show the mean of three independent ATAC-seq experiments. Heatmaps of two sets of ATAC-seq data from non-induced and induced AD-truncated Raji cells are provided in Fig S9.
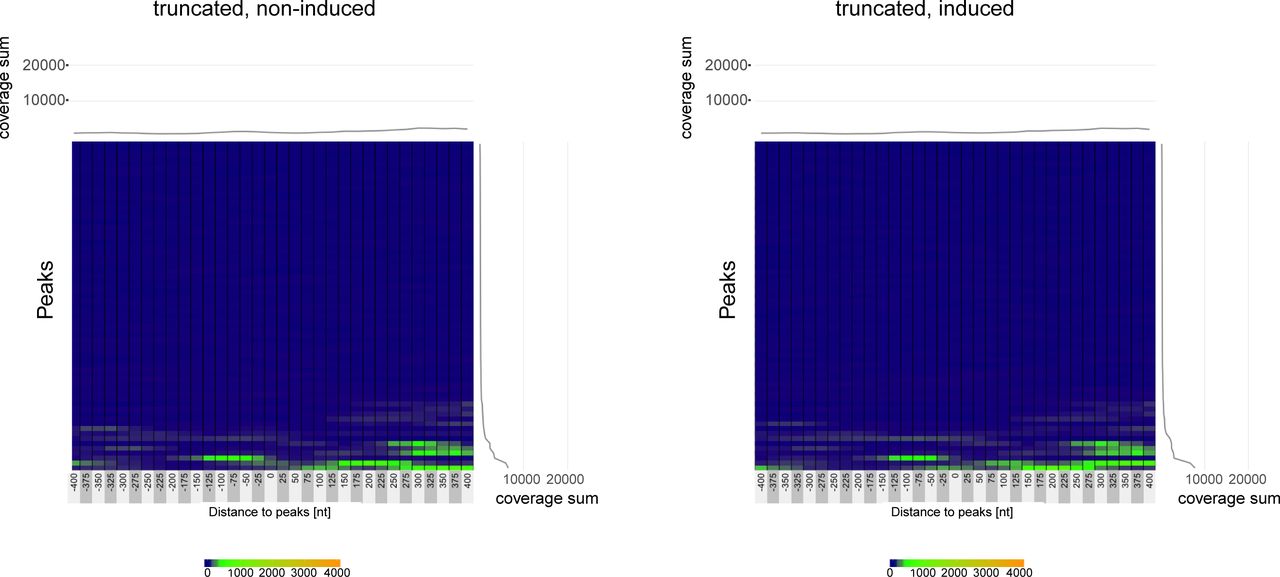
- Figure S9. ATAC-seq coverage at the 67 BZLF1-binding sites in Raji EBV chromatin in non-induced and induced AD-truncated Raji p5694 cells.
The two heatmaps summarize the individual ATAC-seq coverage at the identified 67 BZLF1 ChIP-seq peaks in Raji EBV chromatin arranged in hierarchical order. The left and right panels illustrate the situation in non-induced AD-truncated Raji p5694 cells (truncated, non-induced) and cells induced for 15 h (truncated, induced), respectively. The data show the mean of three independent ATAC-seq experiments.
- Figure S10. Knock-down strategies with shRNA and siRNAs.
(A) Genetic map of the pCDH lentiviral vector encoding DsRed as a fluorescence marker protein, and the context of the flanking sequences with the human miR16-2 backbone for the insertion of guide and passenger strands of three shRNAs (Watanabe et al, 2016) are shown in panel (B). The shRNA strategy was used in experiments shown in Fig S11. (C) siRNA sequence pools purchased from Dharmacon and directed against human INO80 transcripts or a non-targeting control siRNA. (D) Cell viability assays comparing 2089 EBV HEK293 cells transiently transfected with three different siRNAs as indicated for three days. Luminescence values were recorded with the Cell Titer-Glo Kit (Promega) in a CLARIOstar instrument. Values obtained with cells transfected with non-targeting siRNA were set to 100% for comparison. Mean values and standard deviations stem from experiments averaging three different cell concentrations. The siRNA strategy was used in experiments shown in Fig 9.
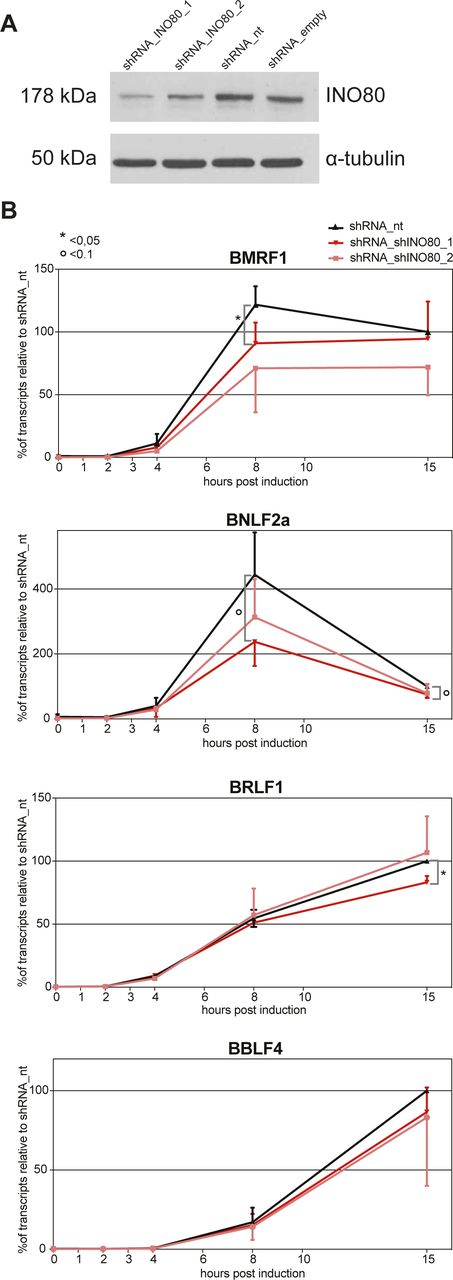
- Figure S11. shRNA knock-downs of INO80 reduce the rapid lytic transcriptional reactivation of certain early lytic EBV genes.
(A) Knock-down efficiency of INO80 protein in Raji p4816 cell lines transduced with lentiviral vectors encoding shRNA_INO80_1 and shRNA_INO80_2 directed against INO80 transcripts or shRNA_nt (non-targeting) and shRNA_empty (no shRNA) as controls. Tubulin served as a loading control. One representative experiment out of three is shown. (B) Transcripts of selected viral early lytic genes (BMRF1, BNLF2a, BRLF1, and BBLF4) in Raji p4816 cell lines transduced with different shRNAs (shRNA_INO80_1, shRNA INO80_2, or shRNA_nt as a negative control) were quantified by RT-qPCR after different time points post induction with 100 ng/ml doxycycline as indicated (2, 4, 8, or 15 h or non-induced, i.e., 0 h). Values obtained with the Raji p4816 cell line transduced with the control shRNA_nt at 15 h post induction were set to 100%. Mean values and SDs from three independent experiments are shown. P-values were calculated using the two-tailed t test; * indicates P < 0.05, ° indicates P < 0.1. Primers used in RT-qPCR reactions are shown in Table S2.
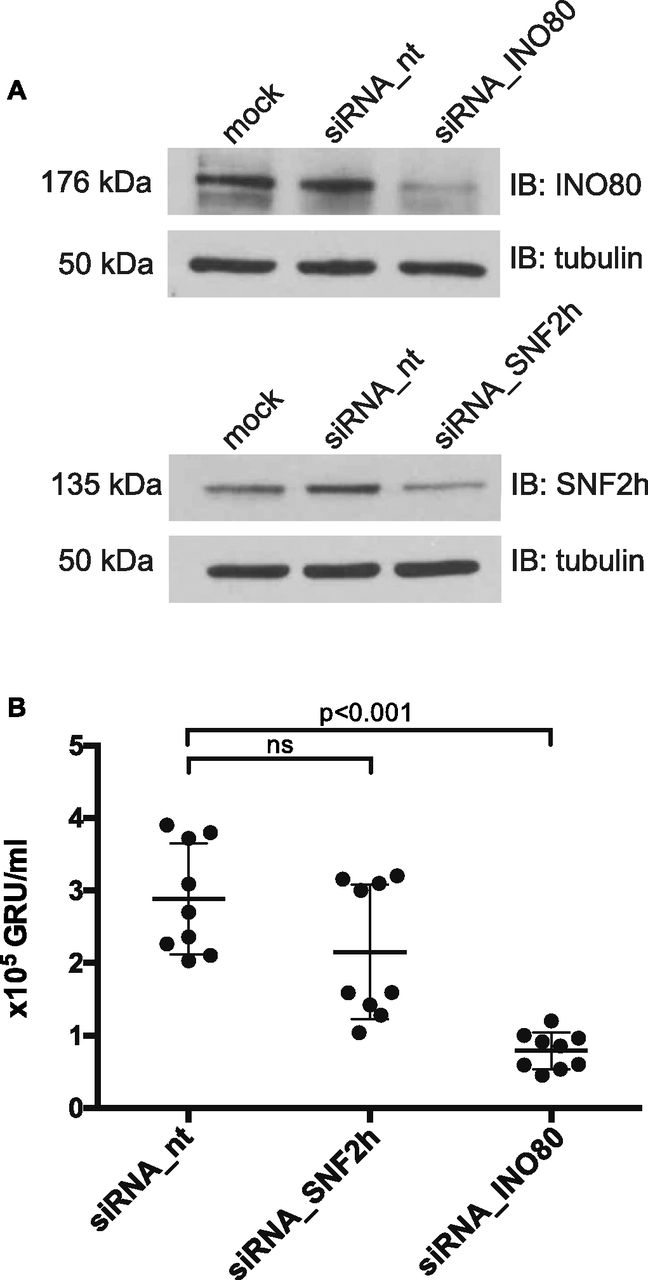
- Figure 9. siRNA knock-down of SNF2h and INO80 subunits reduce virus de novo synthesis.
(A) Knock-down efficiencies of the SNF2h and INO80 ATPase subunits in 2089 EBV HEK293 cells were analyzed by immunoblotting. Tubulin served as a loading control. One representative experiment out of three is shown. Additional information can be found in Fig S10. (B) Quantification of virus concentrations released after lytic induction of 2089 EBV HEK293 cells indicate a reduction of virus synthesis after INO80 knock-down. Mean and SDs from nine independent experiments are shown. P values of an unpaired t test corrected with the Sidak–Bonferroni method are shown. GRU: green Raji units. ns, not significant.


Supplementary Materials
Supplementary Material.
Table S2 Oligonucleotides for qPCR analyses.


In this Issue
Related Articles
Cited By...
- Increased RNA Polymerase Activity and Pausing at CTCF binding sites on the Epstein Barr Virus Genome During Reactivation from Latency
- Systematic analysis of Epstein-Barr virus genes and their individual contribution to virus production and composition
- Pioneer transcription factors in chromatin remodeling: the kinetic proofreading view
- Identifying the Cellular Interactome of Epstein-Barr Virus Lytic Regulator Zta Reveals Cellular Targets Contributing to Viral Replication