


Article Figures & Data
Figures
- Figure S1. T cell–intrinsic STING inhibits cell cycle progression of T cells.
(A) Expression of STING in BMDCs and CD4+ T cells by Western blot. (B) Naive CD8+ T cells from Sting+/+ or Sting−/− mice were stimulated with anti-CD3/CD28 Abs with or without graded amounts of cGAMP for 48 h, and cell growth was assessed by a WST-8 cell proliferation assay. (C) Naive CD4+ T cells from Sting+/− or Sting−/− OT-II Tg mice were cocultured with irradiated T cell–depleted splenocytes from C57BL/6 mice as APCs, together with OVA323–339 peptide (10 μM) in the presence or absence of graded amounts of cGAMP, and cell growth was assessed by a WST-8 cell proliferation assay. (D) Naive CD4+ T cells were pretreated with (open column) or without (closed column) Z-VAD and stimulated with anti-CD3/CD28 Abs with or without cGAMP or DMXAA for 48 h, and cell growth was assessed by a WST-8 cell proliferation assay. (E) Naive CD4+ T cells from Rip3+/+ (closed column) or Rip3−/− (open column) mice were stimulated with anti-CD3/CD28 Abs with or without cGAMP or DMXAA for 48 h, and cell growth was assessed by a WST-8 cell proliferation assay. (F) qPCR analysis of the expression of cell cycle–related genes in CD4+ T cells from Sting+/− (closed column) or Sting−/− (open column) mice upon stimulation with anti-CD3/CD28 Abs in the presence or absence of cGAMP (30 μg/ml) for 24 h. (G) RNA-seq data for the expression of cell cycle–related genes in CD4+ T cells stimulated with anti-CD3/CD28 Abs with or without cGAMP for 24 h. Data are the mean from duplicate (B–E) or triplicate (F) ± SD. Data are representative of at least three independent experiments. (A—F) *P < 0.05, t test (compared with WT cells treated with cGAMP). (E) *P < 0.05, t test (compared with control cells treated with etoposide).
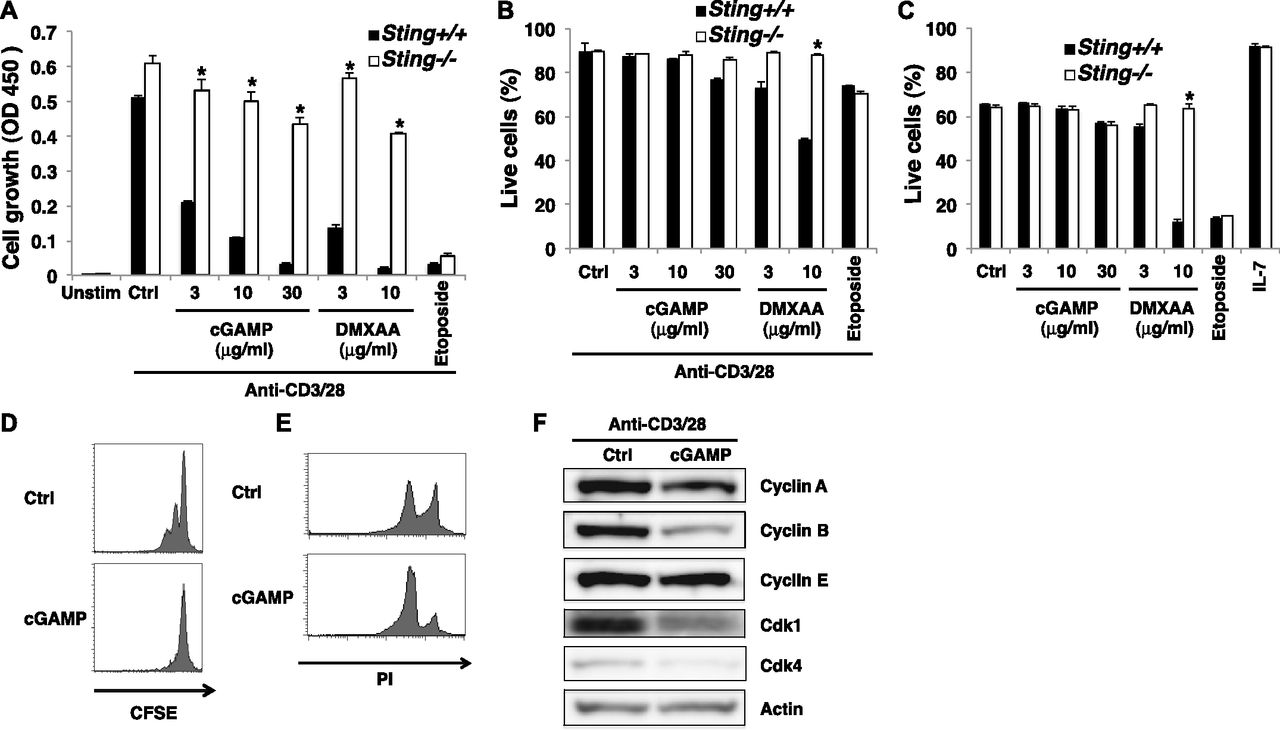
- Figure 1. STING stimulation in T cells inhibits cell cycle progression.
(A, B) FACS-sorted naive CD4+ T cells from Sting+/+ or Sting−/− mice were stimulated with immobilized anti-CD3ε plus anti-CD28 (anti-CD3/CD28) Abs with or without STING ligands cGAMP or DMXAA. Cell growth was assessed after 48 h of stimulation by a WST-8 proliferation assay (A), and cell survival was determined after 18 h of stimulation by Propidium iodide (PI) and Annexin V staining (B). (C) Naive CD4+ T cells from Sting+/+ or Sting−/− mice were stimulated with cGAMP or DMXAA for 18 h, and cell survival was determined by PI and Annexin V staining. (D, E) Naive CD4+ T cells were stimulated with anti-CD3/CD28 Abs with or without cGAMP for 48 h, and cell division was determined by a CFSE-labeling assay (D) and cell cycle was assessed by PI staining (E). (F) Western blot analysis for protein expression of cell cycle–related genes in CD4+ T cells upon stimulation with anti-CD3/CD28 Abs with or without cGAMP for 24 h. Data are the mean from duplicate (A–C) ± SD. Data are representative of at least three independent experiments. (A–F) *P < 0.05, t test (compared with WT cells treated with indicated ligands).
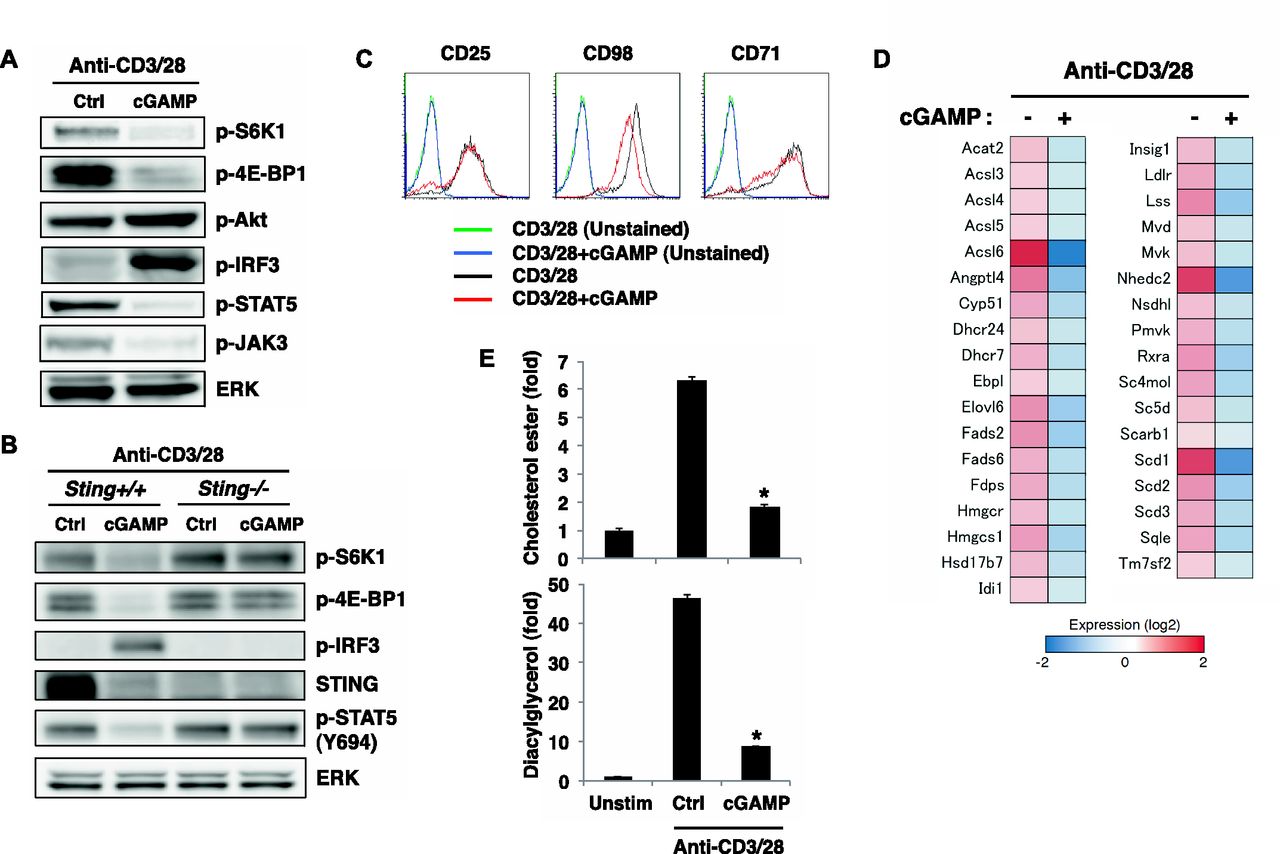
- Figure 2. STING activation leads to the inhibition of the mTORC1 pathway.
(A, B) Western blot analysis of the indicated phosphorylated proteins in CD4+ T cells from Sting+/+ or Sting−/− mice upon stimulation with anti-CD3/CD28 Abs with or without cGAMP for 24 h. (C) FACS analysis of indicated surface molecules on CD4+ T cells upon stimulation with anti-CD3/CD28 Abs with or without cGAMP for 24 h. (D) RNA-seq data of the expression of lipid synthesis–related genes in CD4+ T cells upon stimulation with anti-CD3/CD28 Abs with or without cGAMP for 24 h. (E) Quantification of total cholesterol ester (upper) and total DAG (lower) in CD4+ T cells upon stimulation with anti-CD3/CD28 Abs with or without cGAMP for 24 h, assessed by LC-MS. Data are the mean from triplicate ± SD (E). Data are representative of at least three independent experiments (A–C). (E) *P < 0.05, t test (compared with that with anti-CD3/28 alone).
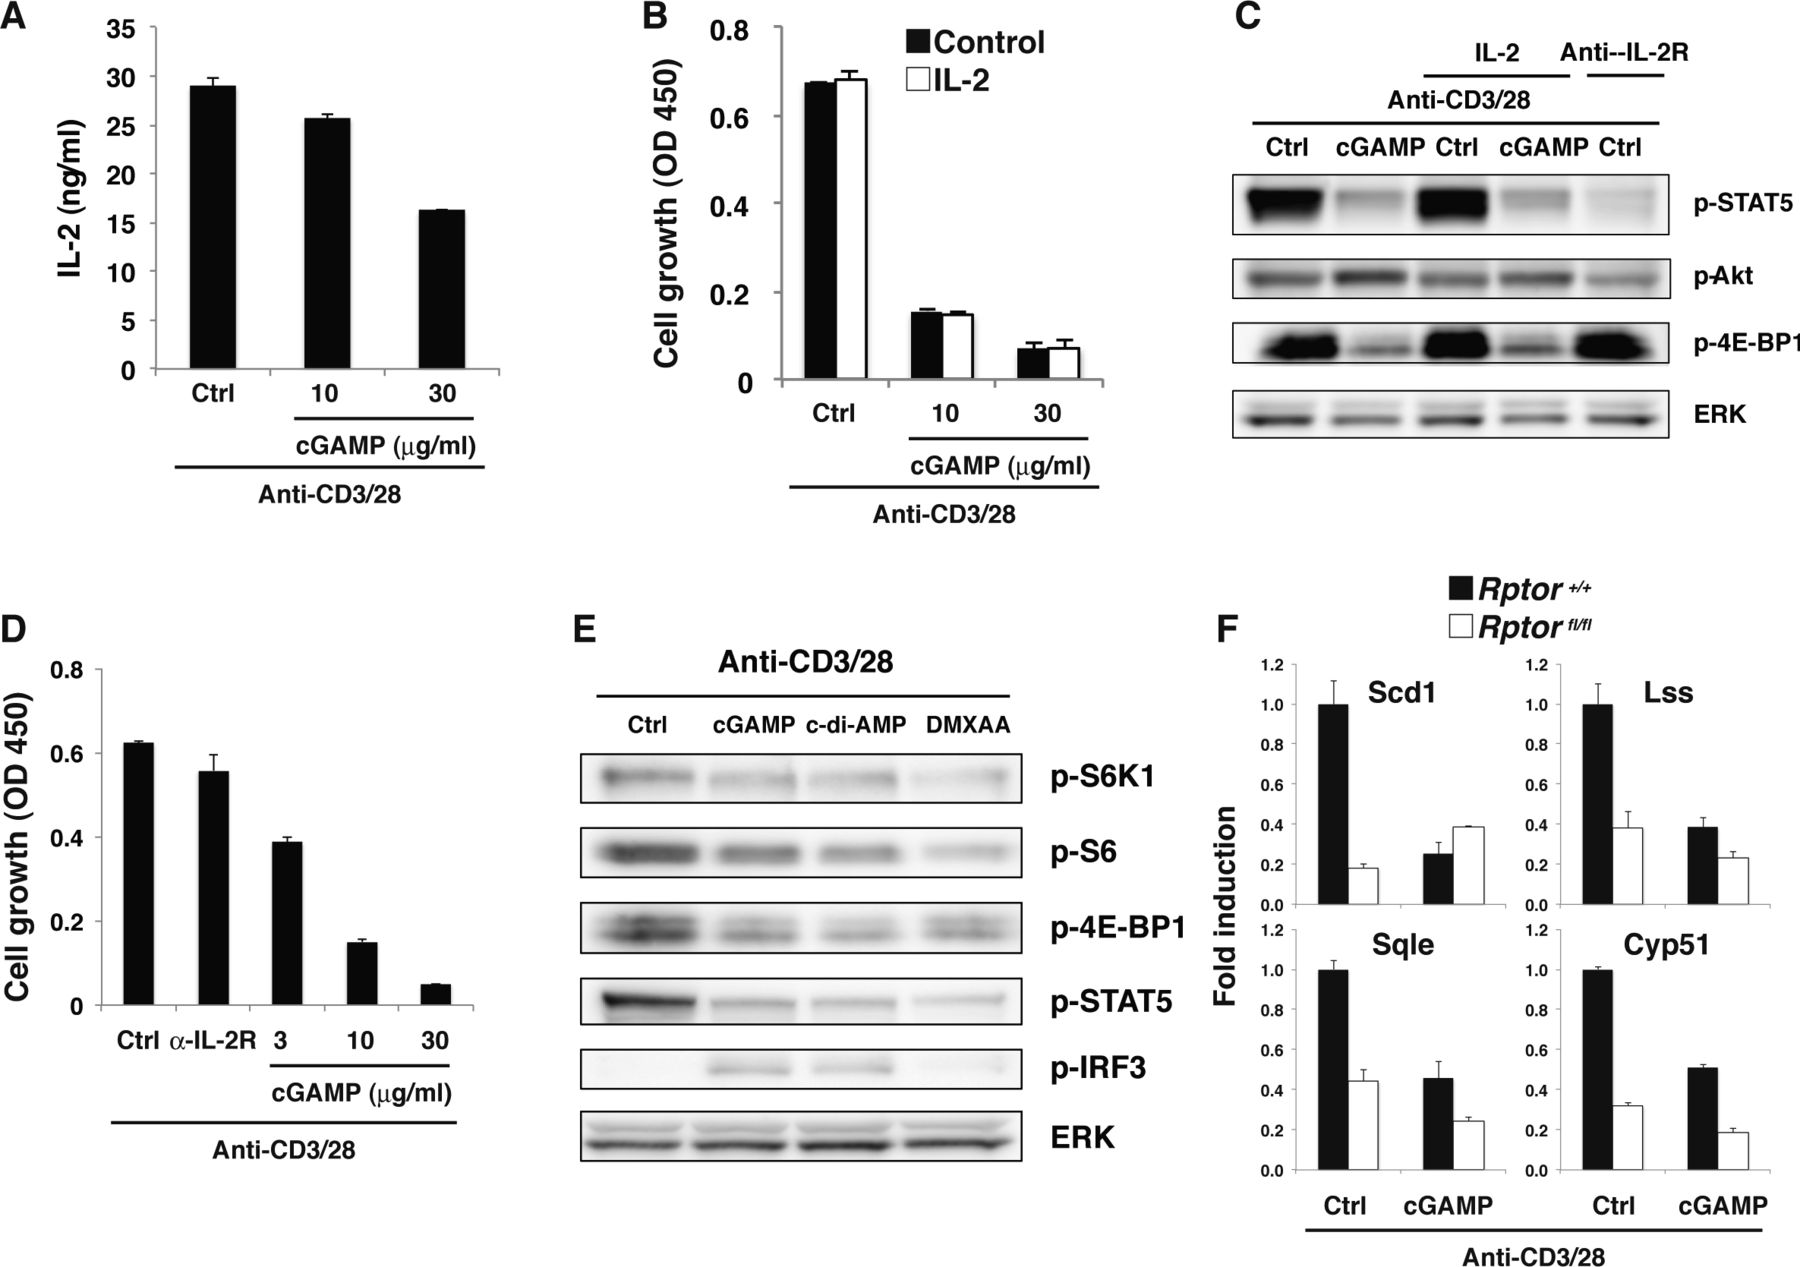
- Figure S2. STING activation induces inhibition of the mTORC1 pathway.
(A) Naive CD4+ T cells were stimulated with anti-CD3/CD28 Abs in the presence or absence of cGAMP for 15 h, and IL-2 production was assessed by ELISA. (B) Naive CD4+ T cells were stimulated with anti-CD3/CD28 Abs in the presence or absence of exogenously added IL-2 (100 ng/ml) and cGAMP, and cell growth was assessed by a WST-8 cell proliferation assay. (C) Western blot analysis of CD4+ T cells stimulated with anti-CD3/CD28 Abs in the presence or absence of cGAMP and IL-2 (100 ng/ml) or anti-IL-2R Ab. (D) Naive CD4+ T cells were stimulated with anti-CD3/CD28 Abs in the presence or absence of anti-IL-2R Ab or cGAMP, and cell growth was assessed by a WST-8 cell proliferation assay. (E) Western blot analysis for activation of mTOR signaling in CD4+ T cells stimulated with anti-CD3/CD28 Abs in the presence or absence of different STING ligands, cGAMP, c-di-AMP, or DMXAA. (F) qPCR analysis for the expression of various genes in CD4+ T cells from Rptor+/+ (closed column) or Rptor-fl/fl (open column) mice stimulated with anti-CD3/CD28 Abs with or without cGAMP for 24 h. Data are the mean from duplicate (A, B) or triplicate (F) ± SD. Data are representative of at least three independent experiments (A–F).
- Figure S3. TCR stimulation induces sustained activation of IRF3 upon CDN stimulation to produce type I IFNs.
(A) RNA-seq data for the expression of IFN-related genes in CD4+ T cells stimulated with anti-CD3/CD28 Abs with or without cGAMP for 24 h. (B) Naive CD4+ T cells were stimulated with anti-CD3/CD28 Abs with or without the indicated STING ligands, and IFN-α production at 24 h (upper) and 48 h (lower) after stimulation was assessed by ELISA. N.D., not detected < 6.2 pg/ml. (C) qPCR analysis for the expression of Ifn genes in CD4+ T cells stimulated with or without (ctrl) cGAMP in the presence or absence of anti-CD3/CD28 stimulation for 24 h. (D) Naive CD8+ T cells from Sting+/− (closed column) or Sting−/− (open column) mice were stimulated with anti-CD3/CD28 Abs and cGAMP for 48 h, and IFN-β production was assessed by ELISA. (E) Naive CD4+ T cells were stimulated with the indicated STING ligands with (open column) or without (closed column) anti-CD3/CD28 stimulation for 48 h, and IFN-λ2/3 production was assessed by ELISA. (F) Naive CD4+ T cells were stimulated with graded doses of anti-CD3/CD28 Abs with (open column) or without (closed column) cGAMP for 48 h, and IFN-α production was assessed by ELISA. (G) Western blot analysis of the expression of the indicated signaling molecules in BMDCs and CD4+ T cells. Data are the mean from duplicate (B, D, E, F) or triplicate (C) ± SD. Data are representative of at least three independent experiments (B–G).
- Figure 3. TCR stimulation induces sustained activation of IRF3 upon CDN stimulation to produce type I IFNs.
(A) Naive CD4+ T cells were stimulated with anti-CD3/CD28 Abs with or without the indicated STING ligands, and the level of IFN-β produced at 24 h (upper) and 48 h (lower) after stimulation was measured by ELISA. N.D., not detected < 2.0 pg/ml. (B) Western blot analysis of the activation status in CD4+ T cells upon stimulation with cGAMP in the presence or absence of stimulation with anti-CD3/CD28 Abs for 5 or 15 h. (C) qPCR analysis of the expression of IFN genes in CD4+ T cells upon stimulation with anti-CD3/CD28 Abs with or without cGAMP for the indicated time period. (D) Western blot analysis for IRF3 activation in CD4+ T cells upon stimulation with different STING ligands in the presence or absence of stimulation with anti-CD3/CD28 Abs. (E) Naive CD4+ T cells from Irf3+/+ or Irf3−/− mice were stimulated with anti-CD3/CD28 Abs in the presence or absence of the indicated ligands, and IFN-β production was assessed by ELISA. (F) qPCR analysis of ISG genes in CD4+ T cells from Irf3+/+ or Irf3−/− mice upon stimulation with anti-CD3/CD28 Abs with or without cGAMP for 24 h. (G, H) Naive CD4+ T cells from Tbk1+/− Tnf−/− or Tbk1−/− Tnf−/− mice were stimulated with anti-CD3/CD28 Abs, with or without cGAMP, and IFN-β production was assessed by ELISA (G), and phosphorylation of IRF3 was assessed by Western blot analysis (H). (I, J) Naive CD4+ T cells from Ikkε+/+ or Ikkε−/− mice were stimulated with anti-CD3/CD28 Abs with or without cGAMP, and IFN-β production was assessed by ELISA (I), and phosphorylation of IRF3 was assessed by Western blot analysis (J). Data are the mean from duplicate (A, E, G, I) or triplicate (C, F) ± SD. Data are representative of at least three independent experiments. (A—J) *P < 0.05, t test (compared with WT cells treated with cGAMP).
- Figure 4. Greatly enhanced STING-mediated type I IFN responses in effector/activated T cells.
(A) Th1 cells or activated CD8+ T cells were stimulated with cGAMP in the presence (IL-2) or absence (unstim) of IL-2 or stimulation with anti-CD3/CD28 Abs for 24 h, and IFN-β production was assessed by ELISA. (B) cGAMP was added to the media or introduced by lipofection into BMDCs for 24 h, and IFN-β production was assessed by ELISA. (C, D) Western blot analysis of phosphorylation of IRF3 and TBK1 in Th1 cells (C) or activated CD8+ T cells (D) upon stimulation with cGAMP with or without IL-2 or anti-CD3/CD28 stimulation. Data are the mean from duplicate ± SD (A, B). Data are representative of at least three independent experiments (A—D).
- Figure S4. Greatly enhanced STING-mediated type I IFN responses in effector/activated T cells.
(A) Th1 cells or activated CD8+ T cells were stimulated with graded doses of cGAMP alone (closed column) or together with IL-2 (grey column) or anti-CD3/CD28 stimulation (open column) for 24 h, and IFN-α production was assessed by ELISA. (B) Graded doses of cGAMP were added to the media or introduced by lipofection into BMDCs for 24 h, and IFN-α production was assessed by ELISA. (C) B220+ B cells were purified and stimulated with graded doses of cGAMP in the presence or absence of stimulation with anti-IgM or LPS for 48 h, and cell growth (upper) and IFN-β production (lower) were assessed by a WST-8 cell proliferation assay and ELISA, respectively. N.D., not detected < 2.0 pg/ml. (D) qPCR analysis for the expression of Ifn genes in B cells upon stimulation with LPS with or without cGAMP for indicated period. Data are the mean from duplicate (A–C) or triplicate (D) ± SD (A–D). Data are representative of at least three independent experiments. (C) *P < 0.05, t test (compared with that with anti-IgM alone or LPS alone).
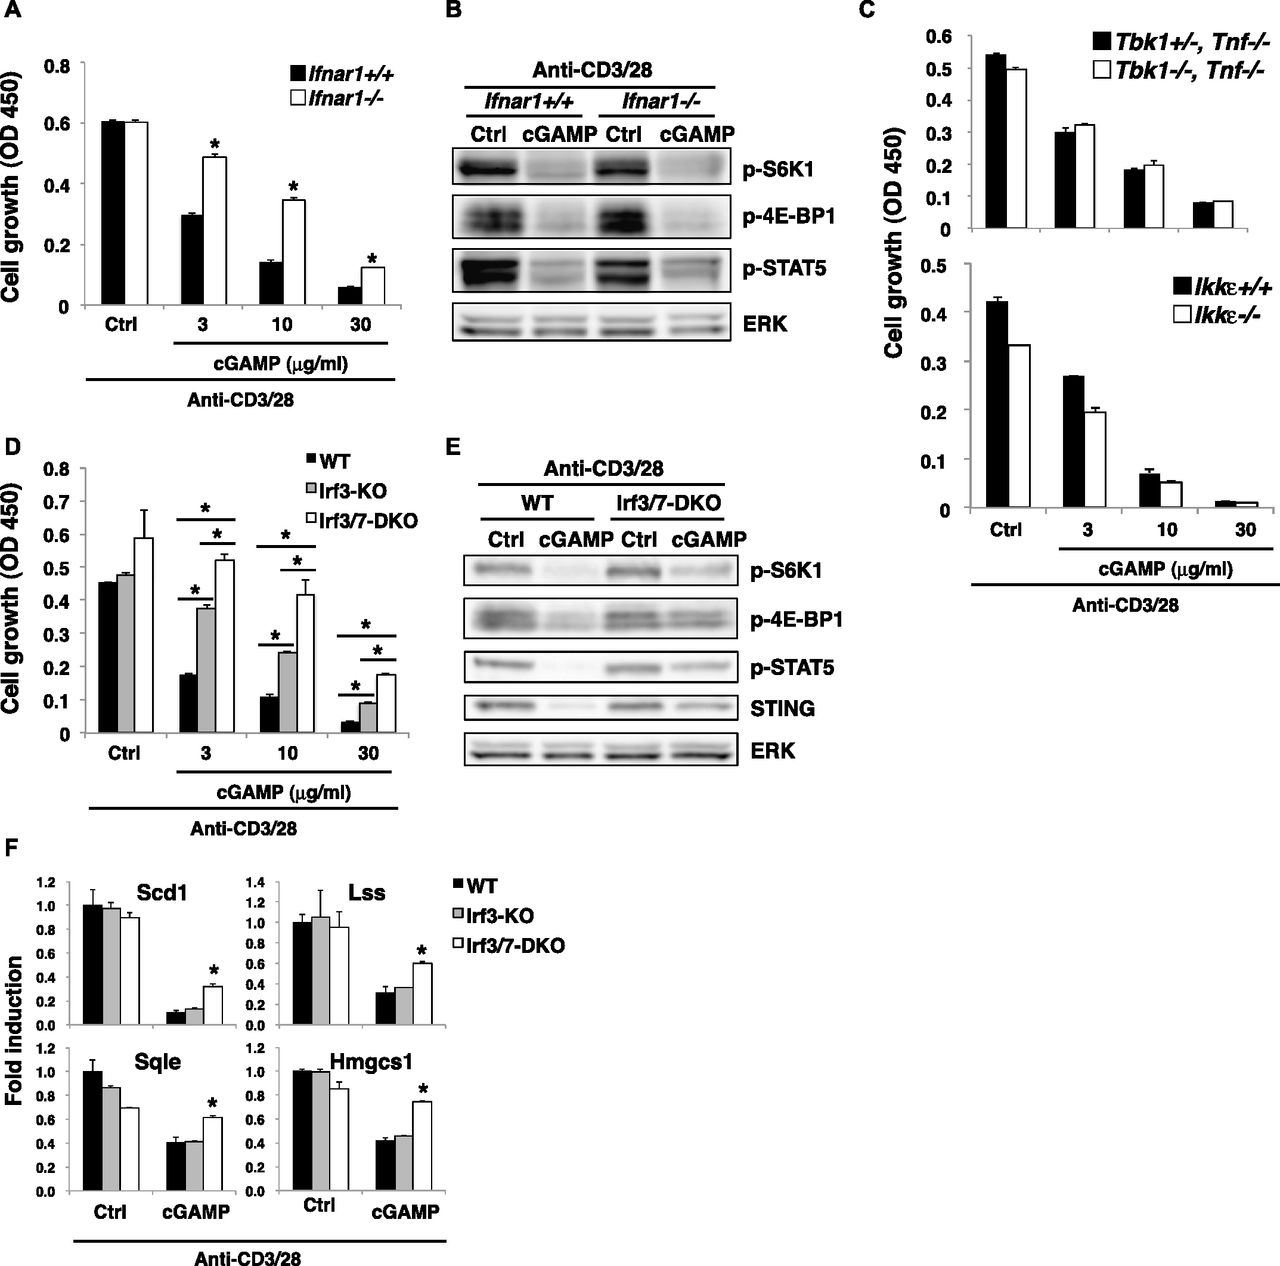
- Figure 5. Molecular mechanism of STING-mediated inhibition of the mTORC1 pathway.
(A, D) Naive CD4+ T cells from Ifnar1+/+ or Ifnar1−/− mice (A) or WT, Irf3−/−, or Irf3−/− Irf7−/− mice (D) were stimulated with anti-CD3/CD28 Abs with or without cGAMP for 48 h, and cell growth was assessed by a WST-8 cell proliferation assay. (B, E) Activation of the mTORC1 pathway was analyzed by Western blot in CD4+ T cells from Ifnar1+/+ or Ifnar1−/− mice (B) or Irf3−/− Irf7−/− (DKO) mice (E) upon stimulation with anti-CD3/CD28 Abs with or without cGAMP for 24 h. (C) Naive CD4+ T cells from Tbk1+/− Tnf−/− or Tbk1−/− Tnf−/− mice (upper) or Ikkε+/+ or Ikkε−/− mice (lower) were stimulated with anti-CD3/CD28 Abs with or without cGAMP, and cell growth was assessed by a WST-8 cell proliferation assay. (F) qPCR analysis of various genes in CD4+ T cells from WT (closed bar), Irf3−/− (grey bar), or Irf3−/− Irf7−/− (open bar) mice upon stimulation with anti-CD3/CD28 Abs with or without cGAMP for 24 h. Data are the mean from duplicate ± SD (A, C, D) or triplicate (F) ± SD. Data are representative of at least three independent experiments (C—F). (A, F) *P < 0.05, t test (compared with WT cells treated with cGAMP). (D) *P < 0.05, t test (compared with WT cells or Irf3-KO cells treated with cGAMP).
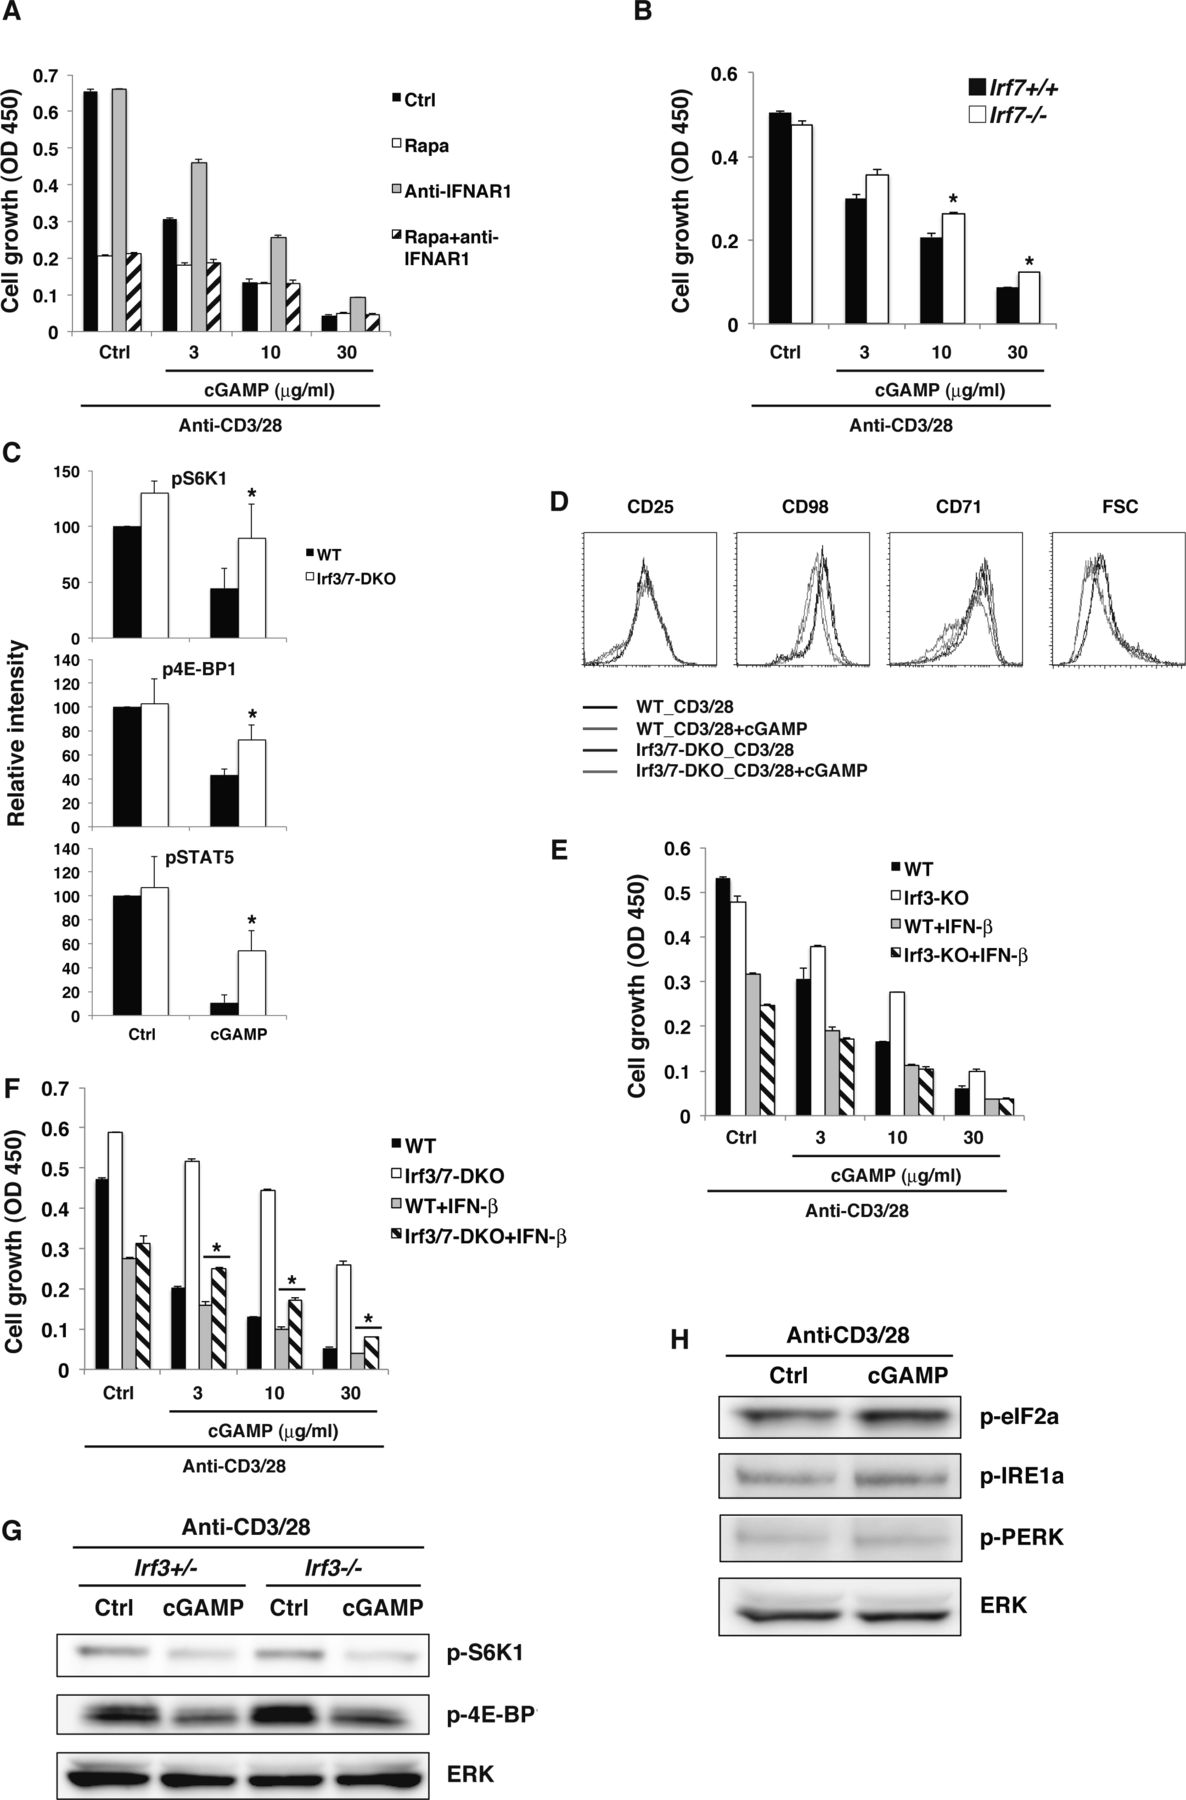
- Figure S5. Molecular mechanism of STING-mediated inhibition of the mTORC1 pathway.
(A) Naive CD4+ T cells were stimulated with anti-CD3/CD28 Abs either with rapamycin (open column) or anti-IFNAR1 Ab (grey column) or both rapamycin and anti-IFNAR1 Ab (diagonal line column) with or without (Ctrl, closed column) cGAMP for 48 h, and cell growth was assessed by a WST-8 cell proliferation assay. (B) Naive CD4+ T cells from Irf7+/+ (closed column) or Irf7−/− (open column) mice were stimulated with anti-CD3/CD28 Abs with or without cGAMP for 48 h, and cell growth was assessed by a WST-8 cell proliferation assay. (C) Quantitative analysis of the data in Fig 5E. Data were collected from four independent experiments. (D) FACS analysis of surface expression of indicated molecules and FSC on CD4+ T cells from WT and Irf3/Irf7-DKO mice upon stimulation with anti-CD3/CD28 Abs with or without cGAMP for 24 h. (E) Naive CD4+ T cells from WT or Irf3-KO mice were stimulated with anti-CD3/CD28 Abs with or without IFN-β (1 ng/ml) or cGAMP for 48 h, and cell growth was assessed by a WST-8 cell proliferation assay. (F) Naive CD4+ T cells from WT or Irf3/Irf7-DKO mice were stimulated with anti-CD3/CD28 Abs with or without IFN-β (1 ng/ml) or cGAMP for 48 h, and cell growth was assessed by a WST-8 cell proliferation assay. (G) Western blot analysis for the mTORC1 activation pathway in CD4+ T cells from Irf3+/+ or Irf3−/− mice. (H) Western blot analysis for the ER stress pathways in CD4+ T cells stimulated with anti-CD3/CD28 Abs in the presence or absence of cGAMP. Data are the mean from duplicate (A, B, E, F) ± SD. Data are representative of two independent experiments. (A, B, D, E, F, G, H) *P < 0.05, t test (compared with WT cells treated with cGAMP). (F) *P < 0.05, t test (compared with WT cells treated with cGAMP and IFN-β).
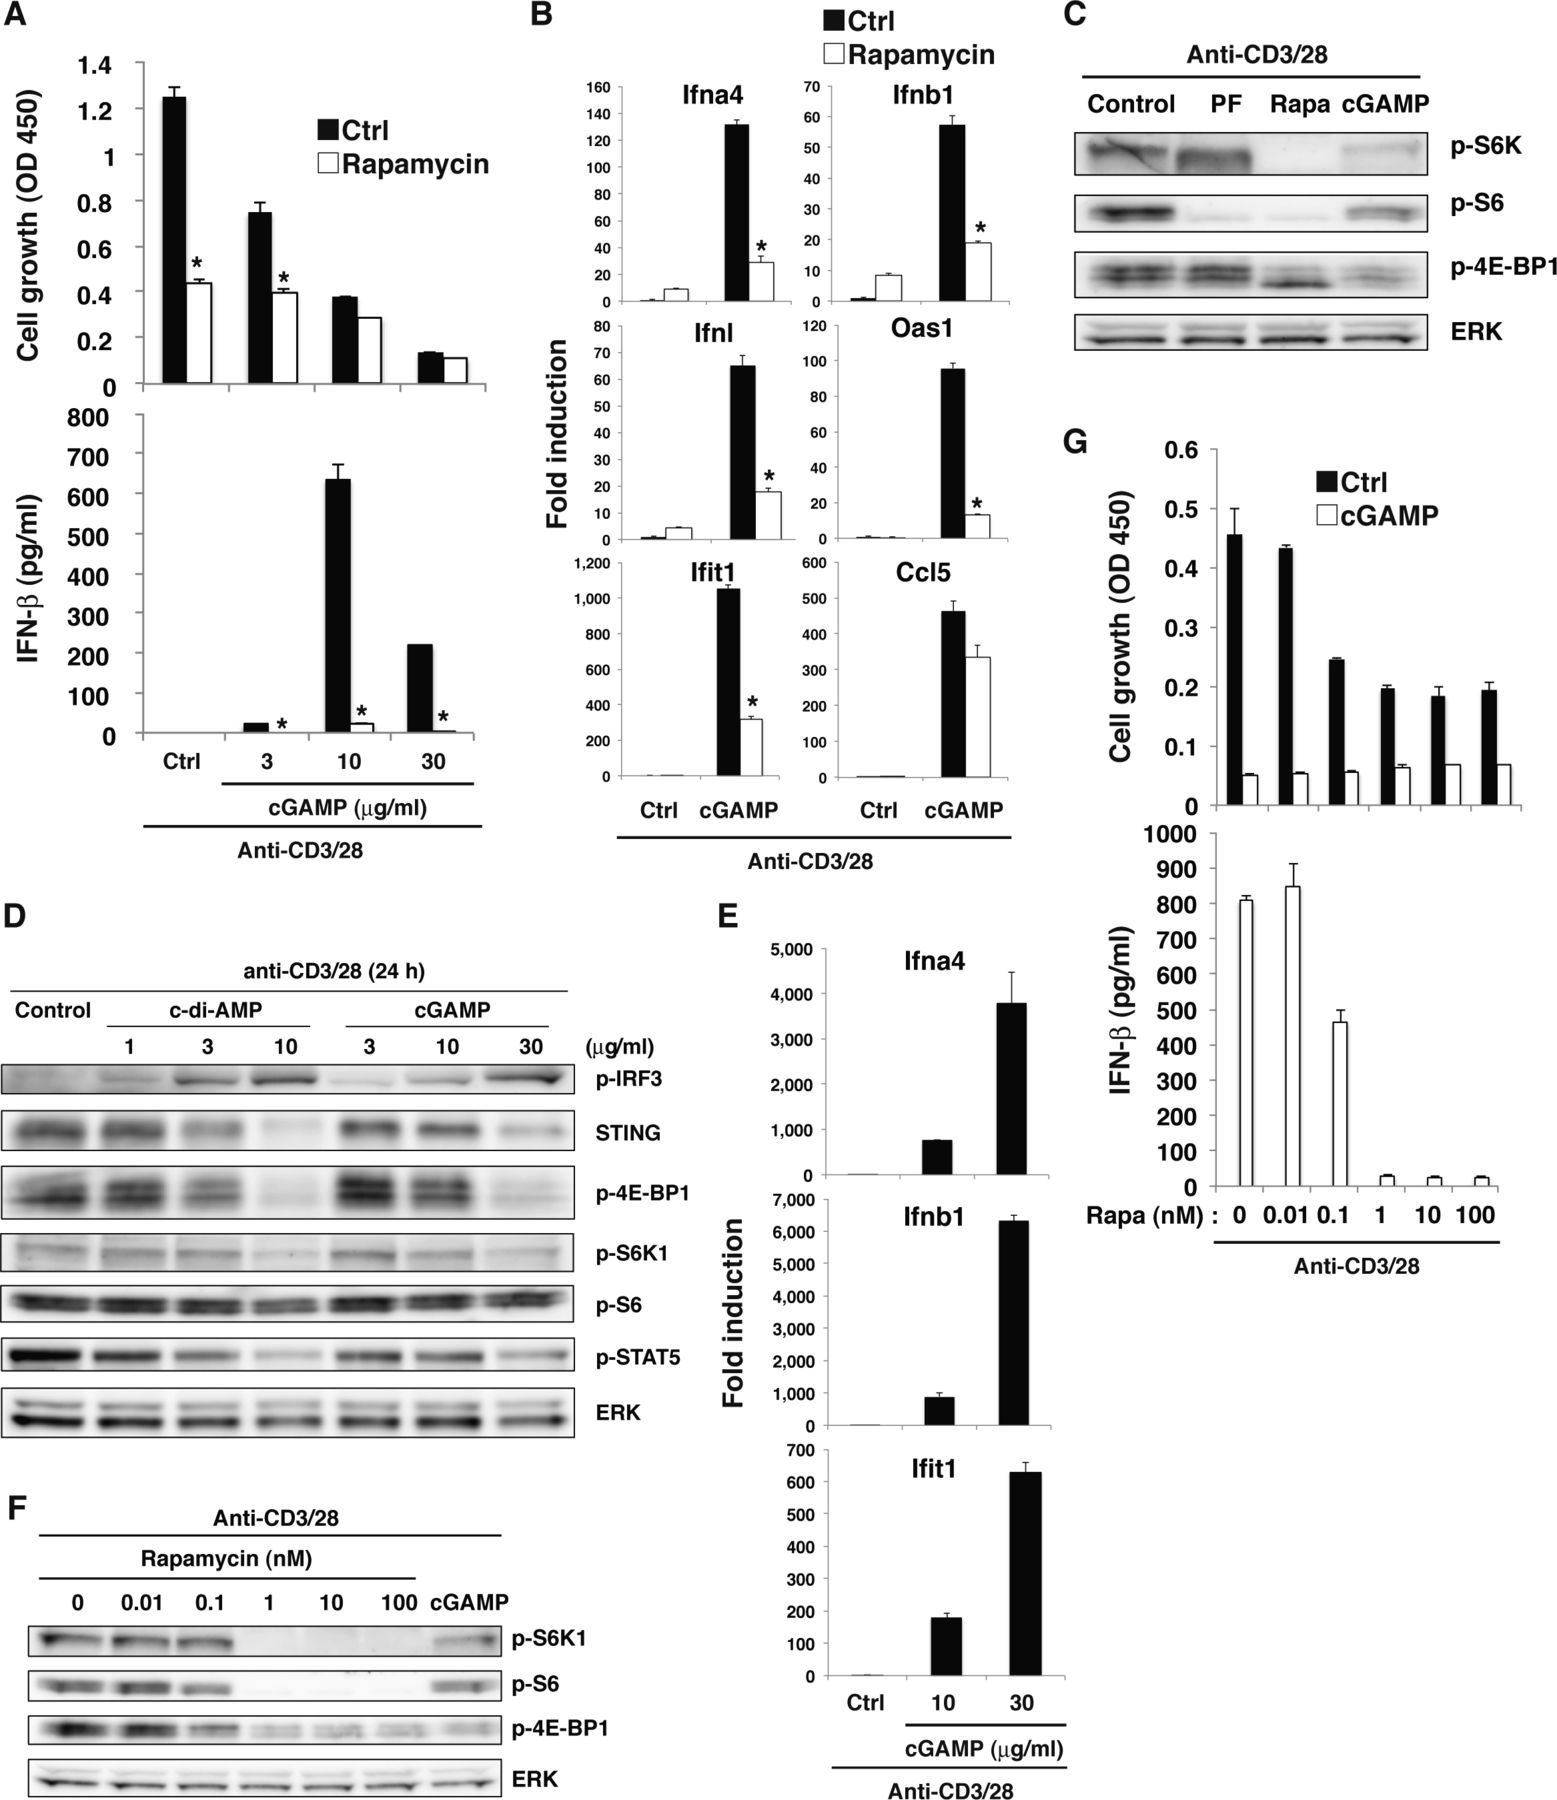
- Figure S6. mTORC1 signaling is required for STING-mediated type I IFN responses.
(A) Naive CD4+ T cells pretreated with (open column) or without (closed column) rapamycin were stimulated with anti-CD3/CD28 Abs in the presence or absence of graded doses of cGAMP for 48 h, and cell growth (upper) and IFN-β production (lower) were assessed by a WST-8 cell proliferation assay and ELISA, respectively. (B) qPCR analysis of Ifn-related genes in CD4+ T cells stimulated with anti-CD3/CD28 Abs in the presence (open column) or absence (closed column) of rapamycin or cGAMP. (C) Western blot analysis for mTORC1 activation in CD4+ T cells stimulated with anti-CD3/CD28 Abs in the presence of PF-4708671 (PF), rapamycin (Rapa), or cGAMP. (D) Western blot analysis for phosphorylation of signaling molecules in CD4+ T cells stimulated with anti-CD3/CD28 Abs in the presence or absence of c-di-AMP or cGAMP. (E) qPCR analysis for the expression of IFN-related genes in CD4+ T cells stimulated with anti-CD3/CD28 with or without cGAMP for 48 h. (F) Western blot analysis of activation of mTORC1-related molecules in CD4+ T cells with or without Rapamycin pretreatment and upon stimulation with anti-CD3/CD28 Abs with or without cGAMP for 24 h. (G) Naive CD4+ T cells pretreated with or without rapamycin were stimulated with anti-CD3/CD28 Abs in the presence or absence of cGAMP (10 μg/ml) for 48 h, and cell growth (upper) and IFN-β production (lower) were assessed by a WST-8 cell proliferation assay and ELISA, respectively. Data are the mean from duplicate (A, G) or triplicate (B, E) ± SD. Data are representative of at least three independent experiments. (A—G) *P < 0.05, t test (compared with control cells treated with or without cGAMP).
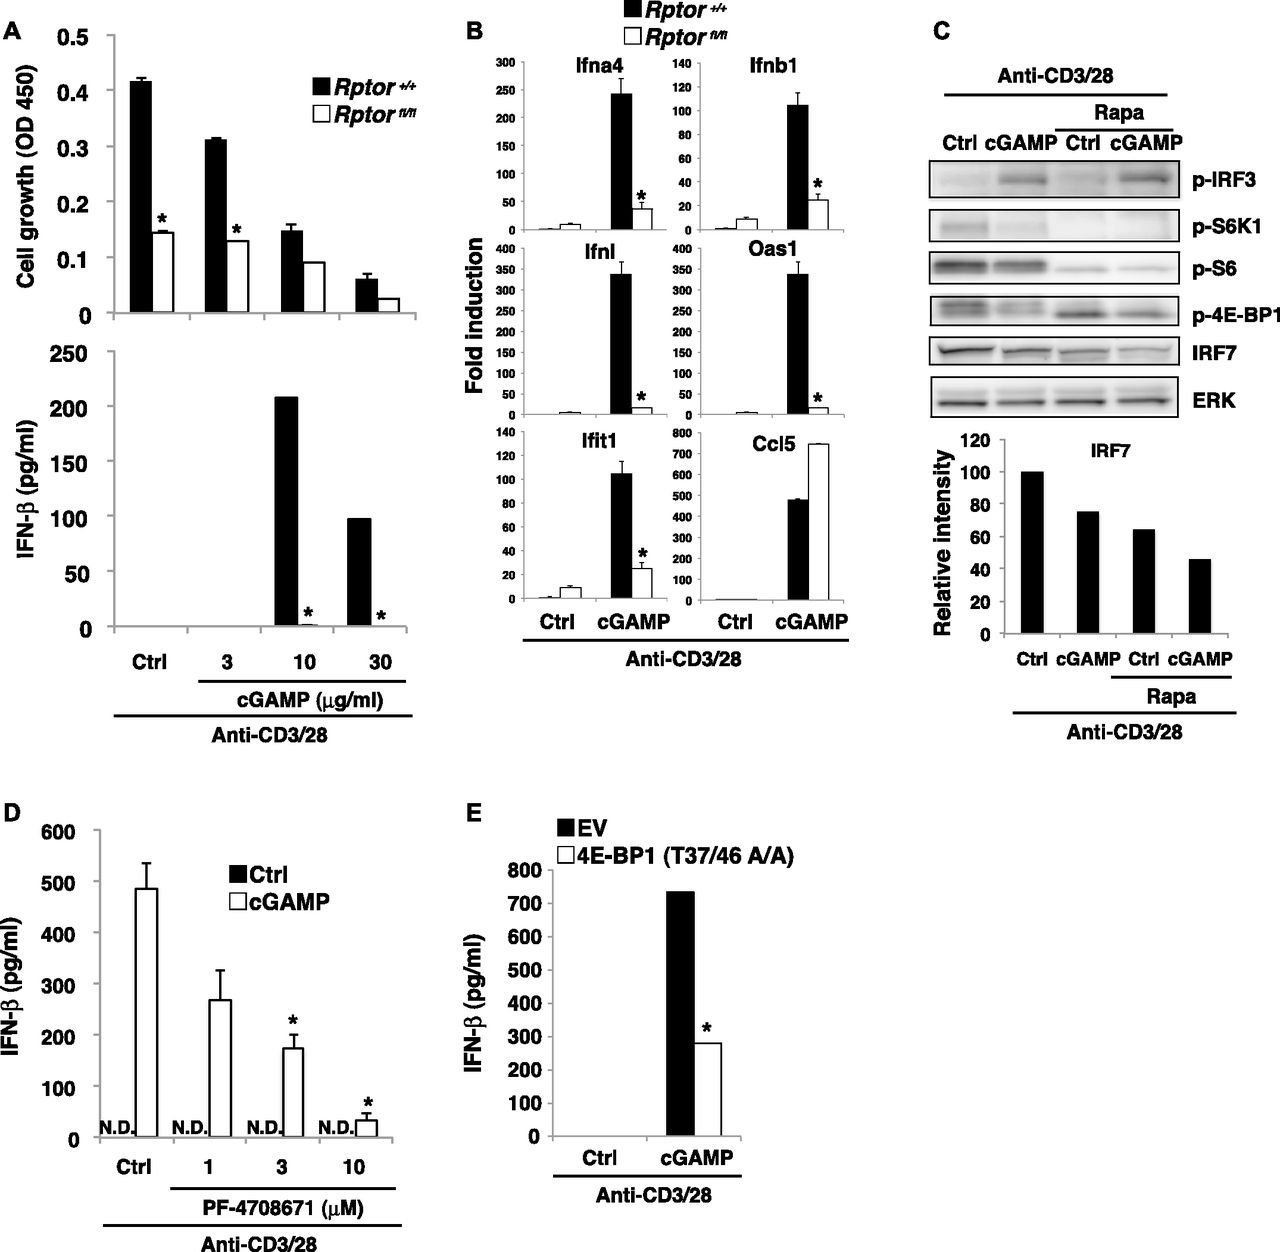
- Figure 6. mTORC1 signaling is required for STING-mediated type I IFN responses.
(A) Naive CD4+ T cells from Rptor+/+ (closed bar) or Rptorfl/fl (open bar) mice were stimulated with anti-CD3/CD28 Abs with or without cGAMP for 48 h, and cell growth (upper) and IFN-β production (lower) were assessed by a WST-8 cell proliferation assay and ELISA, respectively. (B) qPCR analysis of ISG genes in CD4+ T cells from Rptor+/+ (closed bar) or Rptorfl/fl (open bar) mice upon stimulation with anti-CD3/CD28 Abs with or without cGAMP for 24 h. (C) Western blot analysis of activation of IRF3 and mTORC1-related molecules in CD4+ T cells with or without rapamycin pretreatment and upon stimulation with anti-CD3/CD28 Abs with or without cGAMP for 24 h (upper). Relative intensity of IRF7 was shown (lower). (D) Naive CD4+ T cells were untreated or pretreated with S6K inhibitor PF-4708671 and stimulated with anti-CD3/CD28 Abs with or without cGAMP for 48 h, and IFN-β production was assessed by ELISA. N.D., not detected < 2.0 pg/ml. (E) CD4+ T cells were retrovirally transduced with an empty vector (EV) or a 4E-BP1 (T37/46 A/A) construct and stimulated with anti-CD3/CD28 Abs with or without cGAMP for 24 h, and IFN-β production was assessed by ELISA. Data are the mean from duplicate (A, D, E) or triplicate (B) ± SD. Data are representative of at least three independent experiments (C–E). (A, B) *P < 0.05, t test (compared with WT cells treated with cGAMP). (D) *P < 0.05, t test (compared with that with anti-CD3/28 alone). (E) *P < 0.05, t test (compared with control cells treated with cGAMP).
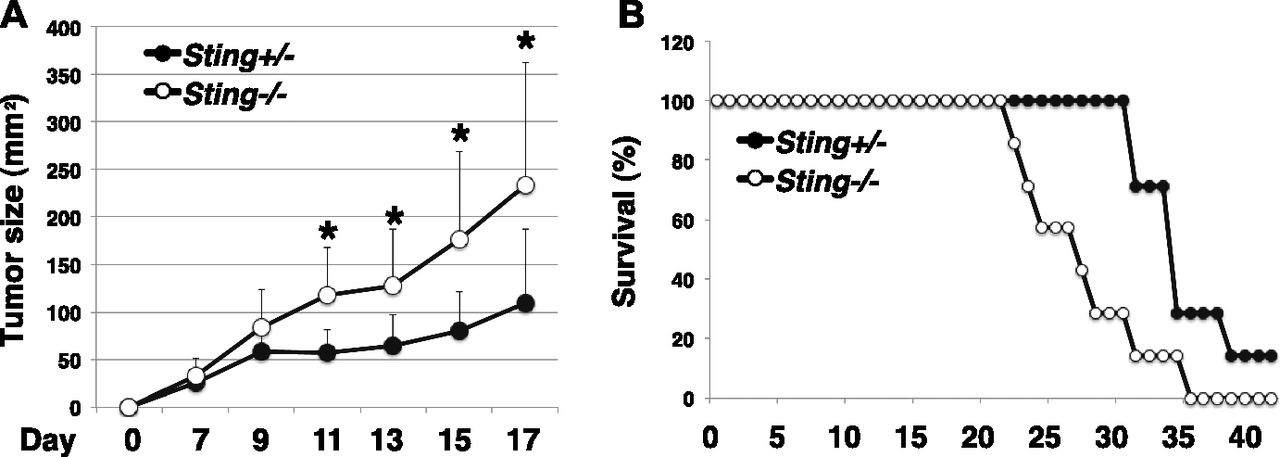
- Figure 7. T cell–intrinsic STING is critical for antitumor immunity.
(A, B) T cells from Sting+/− or Sting−/− mice and B220+ cells from WT mice were cotransferred into Rag1-KO mice (Sting+/−, Sting−/−), and the mice were subcutaneously inoculated with 2 × 10⁵ B16 F10 melanoma cells (n = 7 mice per group). On days 8, 10, and 13, the mice were subjected to intratumor injection of cGAMP and then monitored for tumor growth for 17 d (A) and for survival for 40 d (B). (A) *P < 0.05, t test.


Tables
Count P Enrichment cluster 1 (score, 3.64) Lipid biosynthesis 14 5.1 × 10⁻⁸ Lipid metabolic process 20 8.4 × 10⁻⁶ Lipid metabolism 18 8.9 × 10⁻⁶ Fatty acid desaturase, type 1 5 9.4 × 10⁻⁶ Unsaturated fatty acid biosynthetic process 5 3.3 × 10⁻⁵ Stearoyl-CoA 9-desaturase activity 4 3.7 × 10⁻⁵ Fatty acid biosynthesis 7 3.8 × 10⁻⁵ Fatty acid biosynthetic process 8 4.7 × 10⁻⁵ Biosynthesis of unsaturated fatty acid 6 5.1 × 10⁻⁵ Fatty acid metabolism 9 1.0 × 10⁻⁴ Long-chain fatty acid biosynthetic process 4 1.7 × 10⁻⁴ PPAR signaling pathway 8 2.3 × 10⁻⁴ Palmitoyl-CoA 9-desaturase activity 3 9.2 × 10⁻⁴ Monosaturated fatty acid biosynthetic process 3 9.8 × 10⁻⁴ Enrichment cluster 2 (score, 3.42) Nucleosome 13 1.1 × 10⁻⁸ Negative regulation of cell proliferation 14 1.5 × 10⁻³ Ubl conjugation 31 2.8 × 10⁻³ Enrichment cluster 3 (score, 3.31) ER 34 1.2 × 10⁻⁴ Enrichment cluster 4 (score, 3.01) Sterol biosynthetic process 6 2.2 × 10⁻⁵ Cholesterol biosynthetic process 6 5.2 × 10⁻⁵ Cholesterol biosynthesis 5 7.5 × 10⁻⁵ Steroid biosynthesis 6 7.5 × 10⁻⁵ Cholesterol metabolism 6 4.5 × 10⁻⁴ Sterol metabolism 6 7.8 × 10⁻⁴ Cholesterol metabolic process 7 1.0 × 10⁻³ Steroid biosynthetic process 6 1.2 × 10⁻³ Steroid metabolism 6 1.7 × 10⁻³ Enrichment cluster 4 (score, 2.26) Oxidereductase 19 5.3 × 10⁻⁴ Oxidereductase activity 19 6.0 × 10⁻⁴ Oxidation-reduction process 19 3.0 × 10⁻³ NADP 7 1.7 × 10⁻³ Pathway-enrichment analysis of gene expression with down-regulation in CD4+ T cells stimulated with anti-CD3/28 plus cGAMP for 24 h as compared with those stimulated with anti-CD3/28 alone. Data were analyzed with DAVID Bioinformatics Resources 6.8 and represent one experiment.


In this Issue
Subjects
Related Articles
Cited By...
- CD4 T cell-intrinsic STING signaling controls the differentiation and effector functions of TH1 and TH9 cells
- Epitope spreading driven by the joint action of CART cells and pharmacological STING stimulation counteracts tumor escape via antigen-loss variants
- PERK-STING Signaling Drives Neuroinflammation in Traumatic Brain Injury
- T Cells Produce IFN-{alpha} in the TREX1 D18N Model of Lupus-like Autoimmunity