


Article Figures & Data
Figures
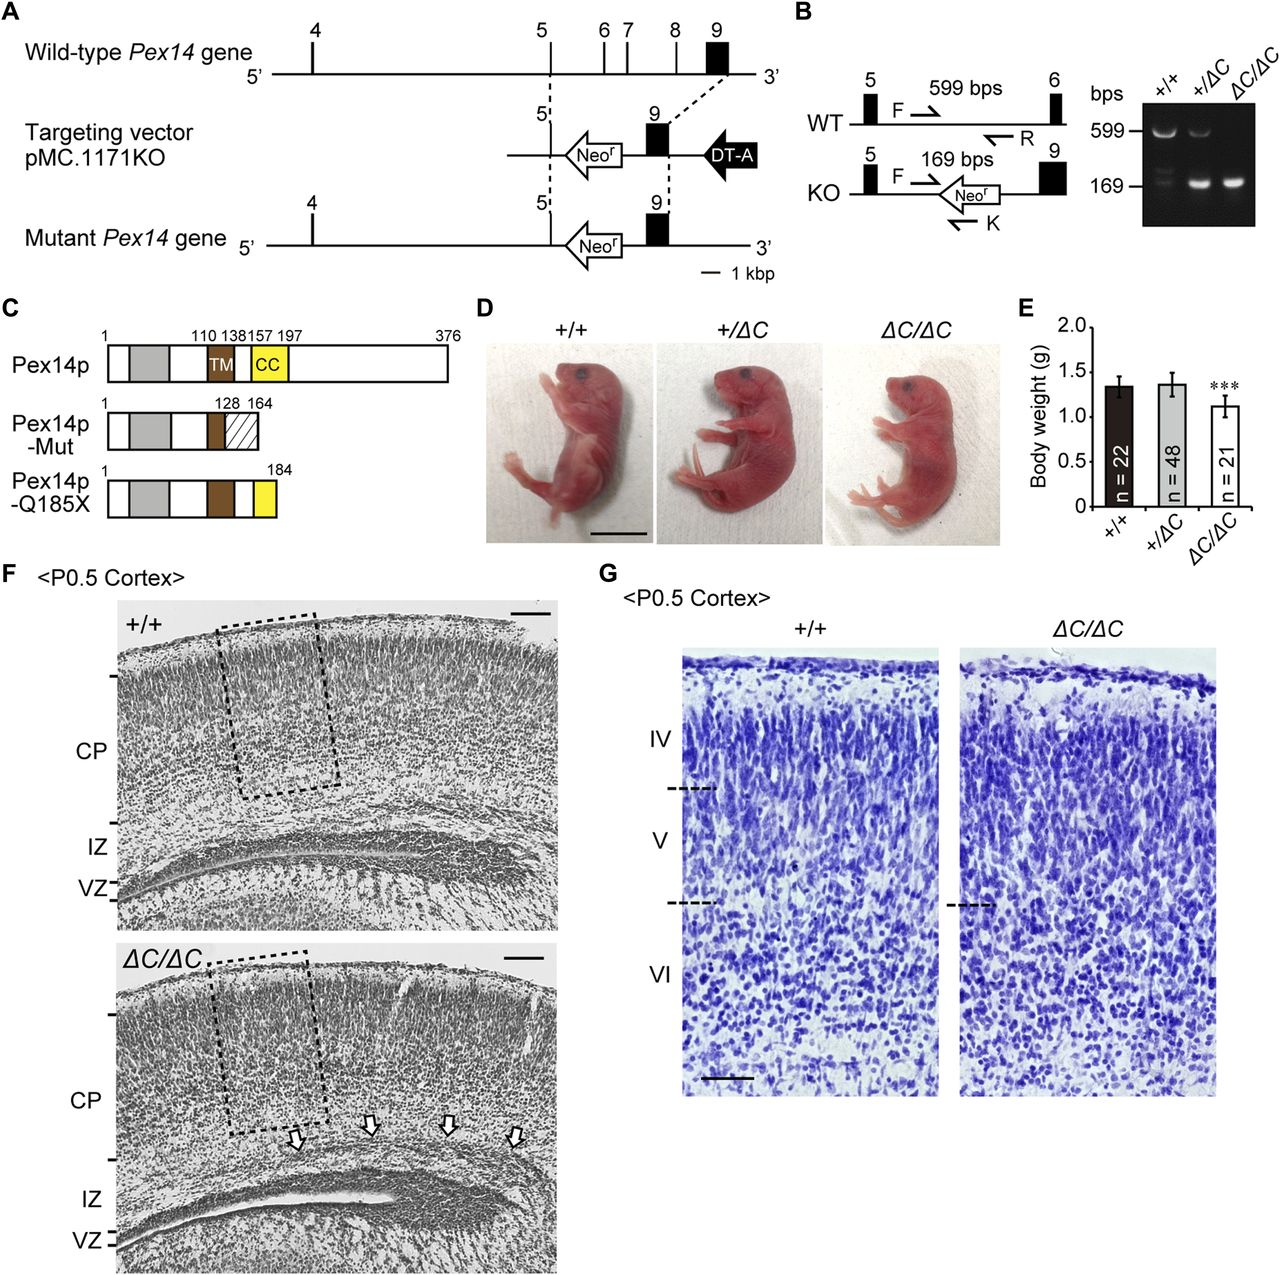
- Figure 1. Targeted disruption of the mouse Pex14 gene.
(A) Schematic representation of the Pex14 genome locus (top), targeting vector (pMC-KO, middle), and targeted allele of the mutated locus following the homologous recombination (bottom). Exon sequences are indicated by black bars and boxes. (B) PCR-based genotyping using tail-derived DNA of wild-type (+/+), heterozygous (+/ΔC), and homozygous (ΔC/ΔC) Pex14 mutant mice. Arrows indicate the sequences used for primers described in the Materials and Methods section. Primers P14F (F) and P14R (R) amplify a 599-bp fragment, and primers F and KN52-2 (K) amplify a 169-bp fragment specific for the recombined Pex14 gene. (C) Schematic structure of predicted Pex14p proteins in wild-type mice, Pex14 mutant mice (Pex14p-Mut), and patients with a Pex14 nonsense mutation, C553T (Pex14p-Q185X). Gray bar, Pex5p-binding domain; brown bar, transmembrane domain (TM); yellow bar, coiled-coil domain (CC); shaded area, altered amino acid sequence caused by a frameshift mutation (129–163). (D) Phenotypic appearance of Pex14 mutant mice ∼12 h after birth. Scale bar, 1 cm. (E) Postnatal body weights were determined at P0.5. The number of pups with each genotype is indicated. ***P < 0.001, by Dunnett's test compared with +/+. (F) Cresyl violet staining of a coronal section of the cortex from a P0.5 mouse. The open arrows indicate accumulated neurons in the intermediate zone (IZ). Scale bar, 100 μm. (G) Enlarged view of the boxed regions in F. Cortical layers are indicated on the left. The boundaries of the cortical plates are indicated by dashed lines. Scale bar, 50 μm. CP, cortical plate; DT-A, diphtheria toxin A cassette; Neor, Neomycin-resistant gene; VZ, ventricular zone.
- Figure S1. Peroxisomal biogenesis deficiency in skin fibroblasts from a patient with PEX14 mutation.
(A) Peroxisomal proteins were analyzed by Western blotting. A truncated form of Pex14p was detected by immunoblotting with an anti-Pex14pN antibody of the cell lysate of fibroblasts from a patient with a PEX14 mutation (Q185X, left panel, arrowhead). The full-length Pex14p was undetectable with an anti-Pex14pC antibody (middle panel). Peroxisomal protein import was assessed by immunoblotting with antibodies to AOx and ADAPS (right panels). Intraperoxisomal conversion of AOx A-chain to B-chain and C-chain and processing from a larger precursor to mature ADAPS were impaired in the patient-derived cells. Dot, a non-specific band. (B) Fibroblasts were stained with antibodies to PTS1, catalase, and PMP70. The catalase was diffused throughout the cytosol, and the fluorescence intensity of PTS1 was reduced in the fibroblasts from the patient. In addition, a smaller number of enlarged puncta labeled with the anti-PMP70 antibody were detected, suggesting that peroxisomal matrix protein import was partially defective. Scale bar, 10 μm. (C–E) VLCPC (C), PlsEtn (D), and DHA-PLs (E) of total phospholipids in skin fibroblasts were quantified by LC-ESI-MS/MS analysis and shown as the levels relative to those of control fibroblast (n = 3). VLCPC was elevated in the fibroblasts from the patient, whereas the reduced levels of PlsEtn and DHA-PLs were milder than those observed in fibroblasts obtained from patients with ZS. ***P < 0.001, by t test compared with control fibroblasts (C–E).
Source data are available for this figure.
Source Data for Figure S1[LSA-2018-00062_SdataF1.pdf]
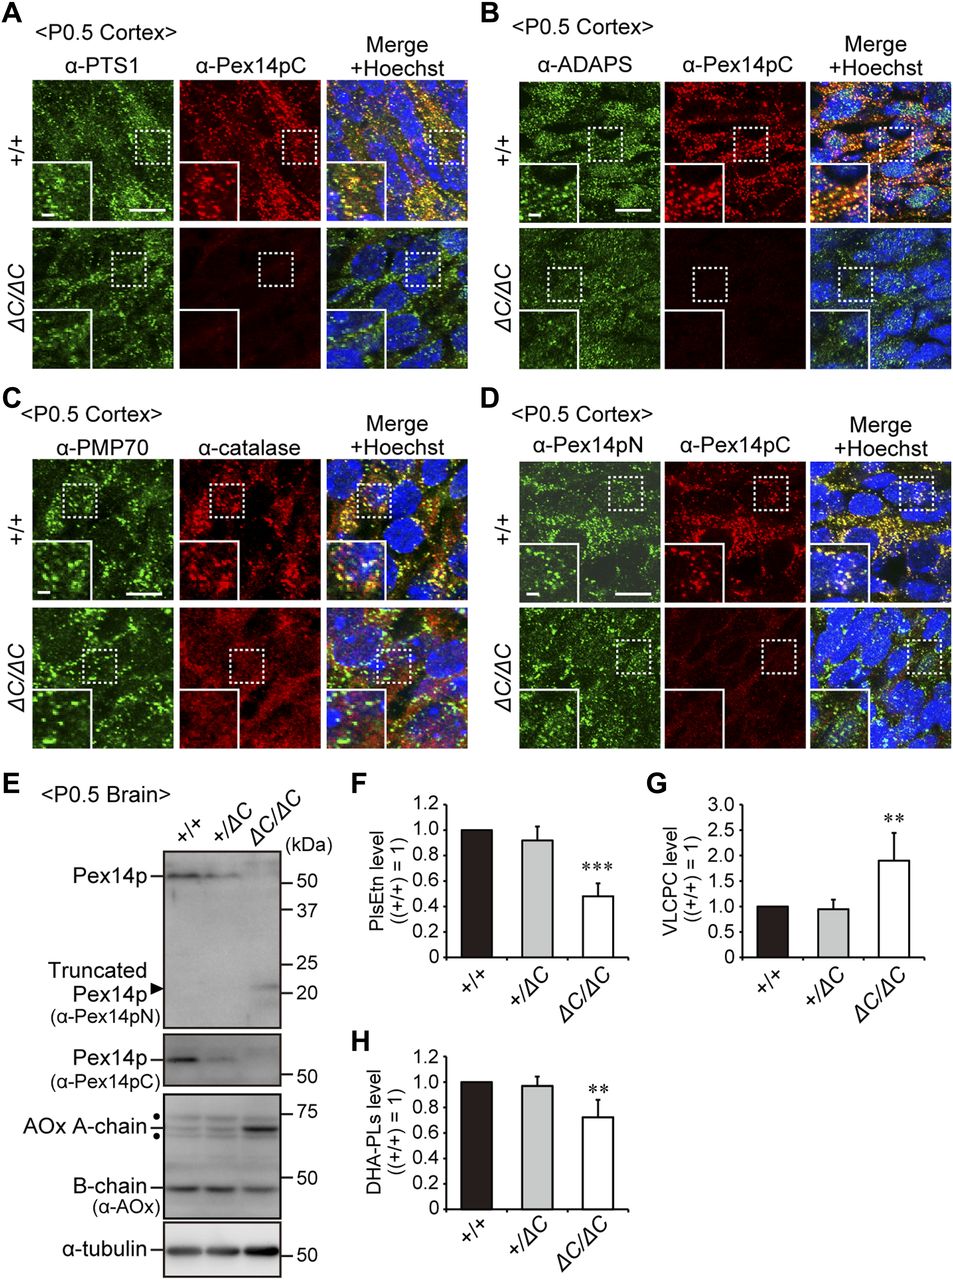
- Figure 2. Impaired peroxisomal biogenesis in the cortex of Pex14ΔC/ΔC mice.
Immunofluorescence labeling of the cortex in wild-type (+/+) and Pex14ΔC/ΔC (ΔC/ΔC) mice. (A–D) The coronal sections of brains were stained with antibodies to PTS1 (green) and Pex14pC (red) (A), ADAPS (green) and Pex14pC (red) (B), PMP70 (green) and catalase (red) (C), or Pex14pN (green) and Pex14pC (red) (D). Staining with Hoechst 33242 (blue) and the merged view are also shown. Scale bar, 10 μm. Higher magnification images of the boxed regions are shown (insets). Scale bar, 2 μm. (E) Brain lysates prepared from wild-type, heterozygous (+/ΔC), and homozygous Pex14 mutant mice were subjected to SDS–PAGE and immunoblotting analysis using antibodies against Pex14pN, Pex14pC, AOx, and α-tubulin. Arrowhead indicates C-terminally truncated Pex14p corresponding to Pex14p-Mut. AOx is synthesized as a 75-kD A-chain and converted to a 53-kD B-chain and a 22-kD C-chain in peroxisomes. AOx A and AOx B chains are shown in immunoblots. Dots, non-specific bands. (F–H) Total amounts of PlsEtn (F), VLCPC (G), and DHA-PLs (H) are represented relative to those in the wild-type mouse brain (n = 3). **P < 0.01, ***P < 0.001, by Dunnett's test compared with +/+.
Source data are available for this figure.
Source Data for Figure 2[LSA-2018-00062_SdataF1.pdf]
- Figure S2. Brain morphology of Pex14 mutant mice.
Cresyl violet staining of coronal sections of the brains from wild-type (+/+, left panel) and Pex14ΔC/ΔC (ΔC/ΔC, right panel) mice (P0.5). Scale bar, 1 mm.
- Figure 3. Defect of cerebellar development and malformation of Purkinje cells in Pex14ΔC/ΔC BL/ICR mice.
(A) Percentage of pups surviving at postnatal days. The survival days were based on the pups of 22 wild-type (+/+) and 25 Pex14ΔC/ΔC (ΔC/ΔC) BL/ICR mice. (B) Body weights of pups at postnatal days were plotted. (C) Hematoxylin and eosin staining of the sagittal sections of the cerebellum (P7). Arrowheads indicate the shallow cerebellar folia in the cerebellum of the Pex14ΔC/ΔC BL/ICR mouse (lower panel). Scale bar, 500 μm. (D) The sagittal section of the cerebellum at P7 was stained with hematoxylin and eosin. Scale bar, 20 μm. (E) Thickness of EGL was quantified (n = 3). (F, G) Confocal microscopy images of the sagittal sections of the cerebellum at P3 labeled with an antibody to calbindin-D28k, a Purkinje cell marker. Arrows indicate axons of wild-type Purkinje cells and arrowheads indicate swollen axons of Pex14 mutant Purkinje cells. Scale bar, 10 μm. (H) Percentage of swollen axons was quantified (+/+, n = 54; ΔC/ΔC, n = 52). (I) Confocal microscopy images of sagittal sections of the cerebellum at P7 labeled with an antibody to calbindin-D28k are shown. Arrows indicate axons of wild-type Purkinje cells and arrowheads indicate axonal reticular structures of Pex14 mutant Purkinje cells. Scale bar, 10 μm. ***P < 0.001, by t test (E) and χ2 test (H). EGL, external granular layer; IGL, internal granular layer; ML, molecular layer; PCL, Purkinje cell layer.
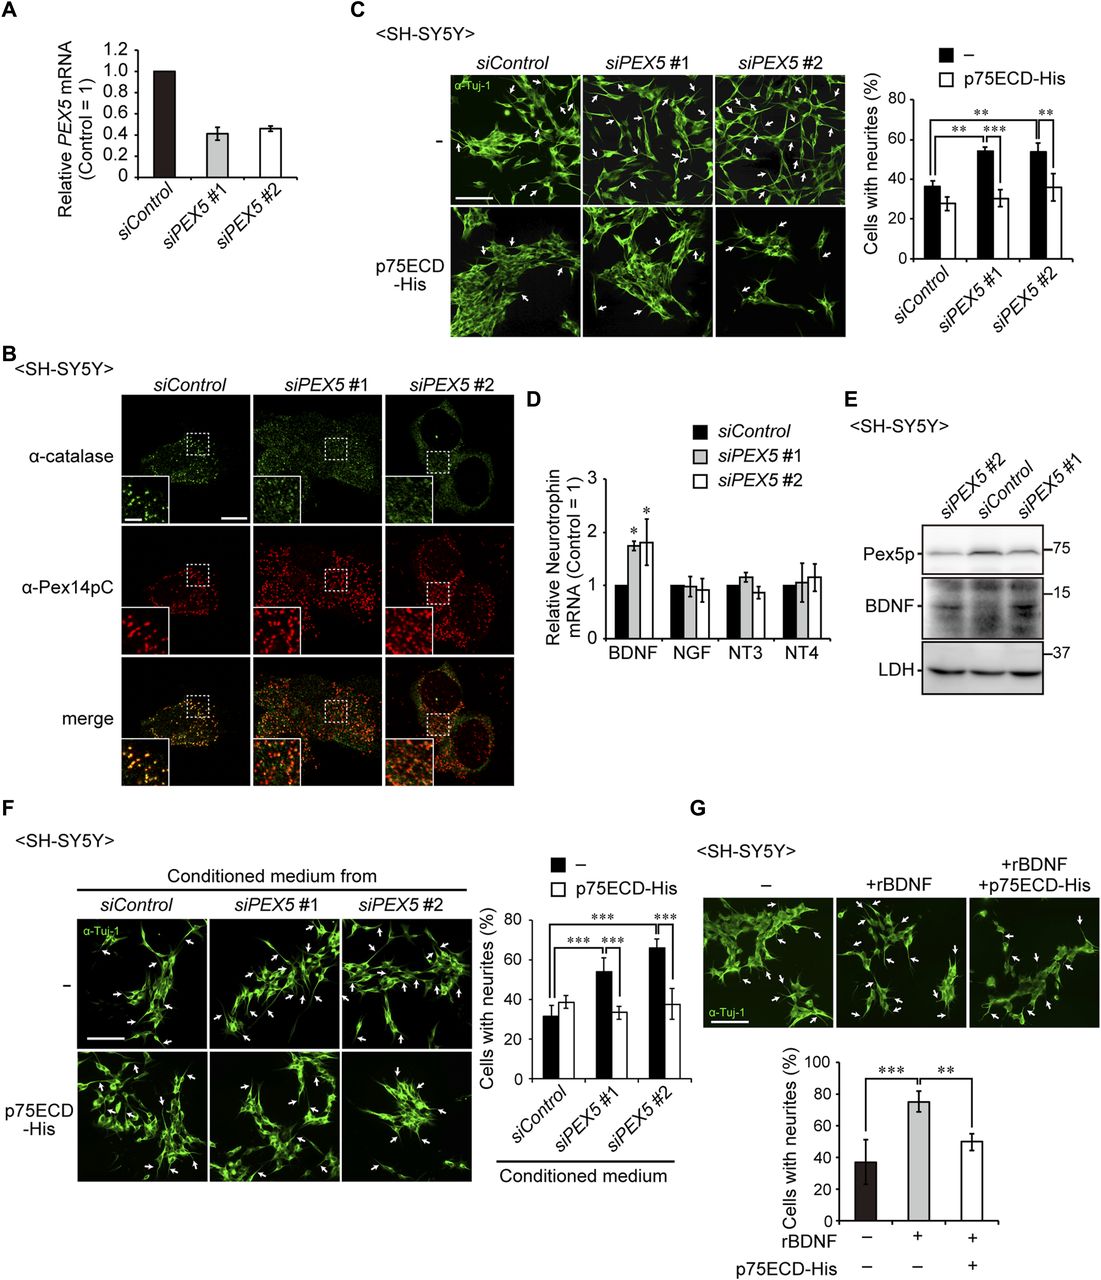
- Figure 4. Up-regulation of BDNF induces the neurite outgrowth of SH-SY5Y cells.
(A) SH-SY5Y cells were treated with a control siRNA (siControl) or siRNAs against PEX5 (#1 and #2) and cultured for 48 h. PEX5 mRNA level was determined by real-time PCR (n = 3). (B) Cells were stained with anti-catalase (green) and Pex14pC (red) antibodies. Scale bar, 10 μm. Higher magnification images of the boxed regions are shown (inset). Scale bar, 2 μm. (C) SH-SY5Y cells treated with siRNAs were cultured in the presence or absence of the recombinant extracellular domain of p75NTR (p75ECD-His, amino acid sequence at 1–747) and stained with anti-Tuj-1 antibody (green). Arrows indicate neurons with neurite outgrowth. Percentage of neurons with neurite outgrowth were determined and shown on the right (n > 100 cells; three cultures each). Scale bar, 100 μm. (D) mRNA levels of neurotrophins in SH-SY5Y cells were assessed by real-time PCR (n = 3). (E) SH-SY5Y cell lysates were analyzed by SDS-PAGE and immunoblotting with antibodies against Pex5p, BDNF, and LDH. (F) Conditioned medium was obtained from the culture of SH-SY5Y cells treated with siRNAs that had been cultured for 2 d. SH-SY5Y cells were incubated in the collected conditioned medium in the presence or absence of p75ECD-His for 2 d. Percentages of neurons with neurite outgrowth were determined and shown on the right (n > 100 cells; three cultures each). Scale bar, 100 μm. (G) SH-SY5Y cells were cultured in the presence or absence of recombinant BDNF (rBDNF) and p75ECD-His. Cells were stained with anti-Tuj-1 antibody (green, upper panels). Percentages of neurons with neurite outgrowth were shown in a lower panel (n > 100 cells; five cultures each). Scale bar, 100 μm. Data represent means ± SD. *P < 0.05, **P < 0.01, ***P < 0.001, by Tukey–Kramer test (C, F, G) and Dunnett's test (D).
Source data are available for this figure.
Source Data for Figure 4[LSA-2018-00062_SdataF1.pdf]
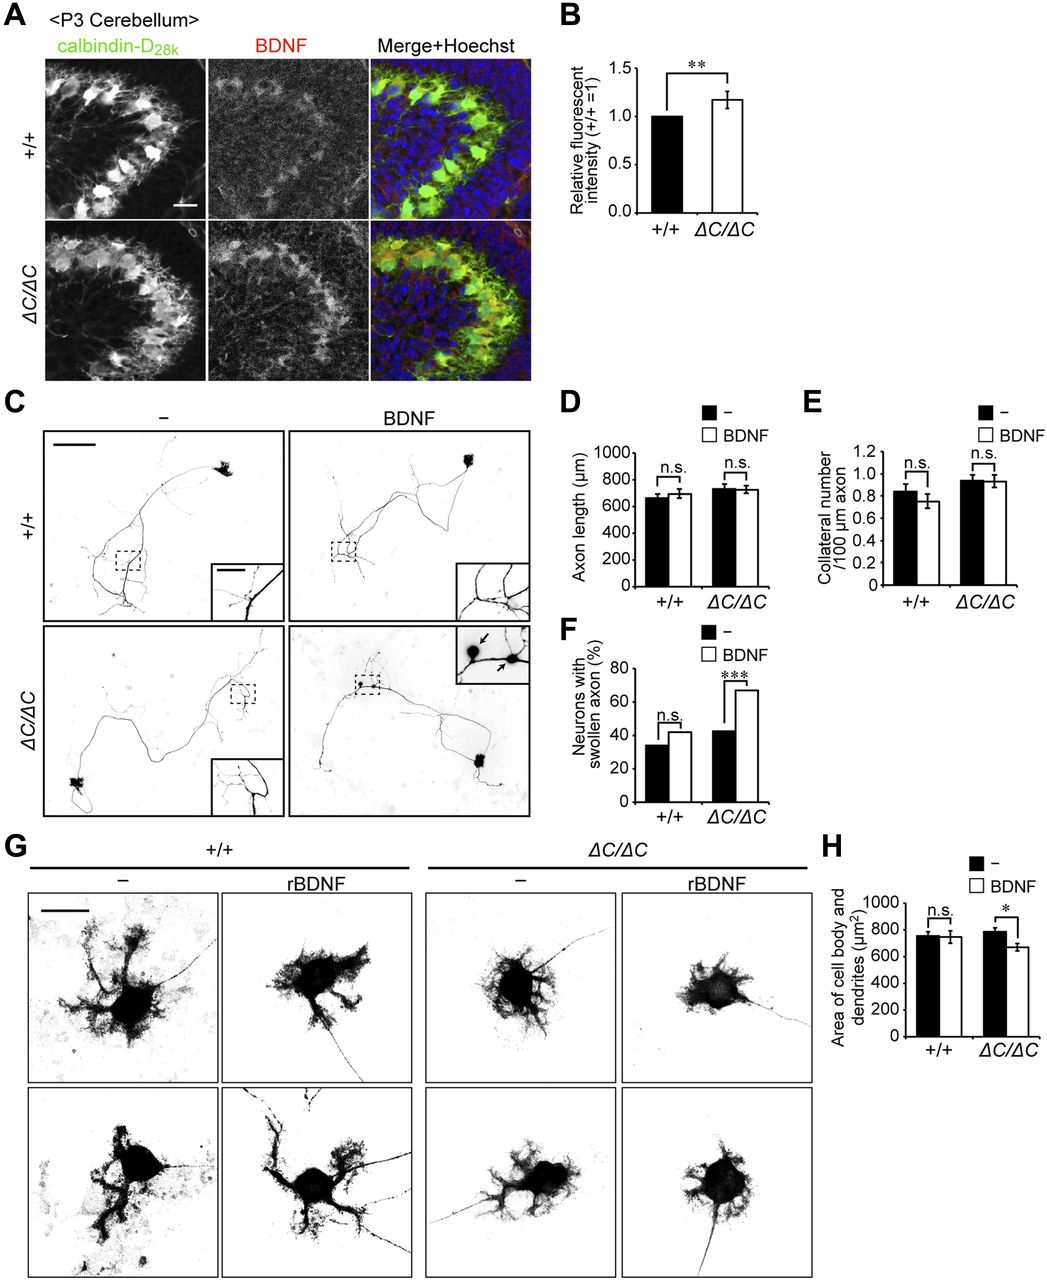
- Figure 5. Axonal swelling and impairment of dendritic development in Purkinje cells from Pex14ΔC/ΔC BL/ICR mouse upon treatment with BDNF.
(A) Sagittal sections of the cerebellum from wild-type (+/+) and Pex14ΔC/ΔC (ΔC/ΔC) BL/ICR mice were labeled with anti-calbindin-D28k (left panels, green) and BDNF (middle panels, red) antibodies. Merged views of the two different proteins and staining with Hoechst 33242 (blue) are shown on the right. Scale bar, 50 μm. (B) Relative fluorescent intensity of BDNF was quantified (n = 4). (C) Primary cerebellar neurons were cultured in the absence or presence of 50 ng/ml BDNF for 14 DIV. The cells were fixed and stained with antibody against calbindin-D28K. Reverse images of Purkinje cells are shown. Scale bar, 100 μm. Higher magnification image of the boxed region is shown in the inset. Arrows indicate swollen axons of Purkinje cell. Scale bar, 20 μm. (D, E) Statistical analyses were performed for neuronal axon length (D) and the number of collaterals per 100-μm axon (E). Data represent means ± SEM. (F) The percentage of swollen axons (>2 μm diameter) was quantified. (G) Enlarged view of the reverse images of Purkinje cell bodies are shown (upper and lower panels). Scale bar, 20 μm. (H) Areas of the cell body and dendrites of Purkinje cells were measured (+/+: n = 64; +/+, rBDNF: n = 42; ΔC/ΔC: n = 110; ΔC/ΔC, rBDNF: n = 109). Data represent means ± SEM. ns, not significant, *P < 0.05, **P < 0.01, ***P < 0.001, by t test (B), Tukey–Kramer test (D, E, H), and χ2 test (F).
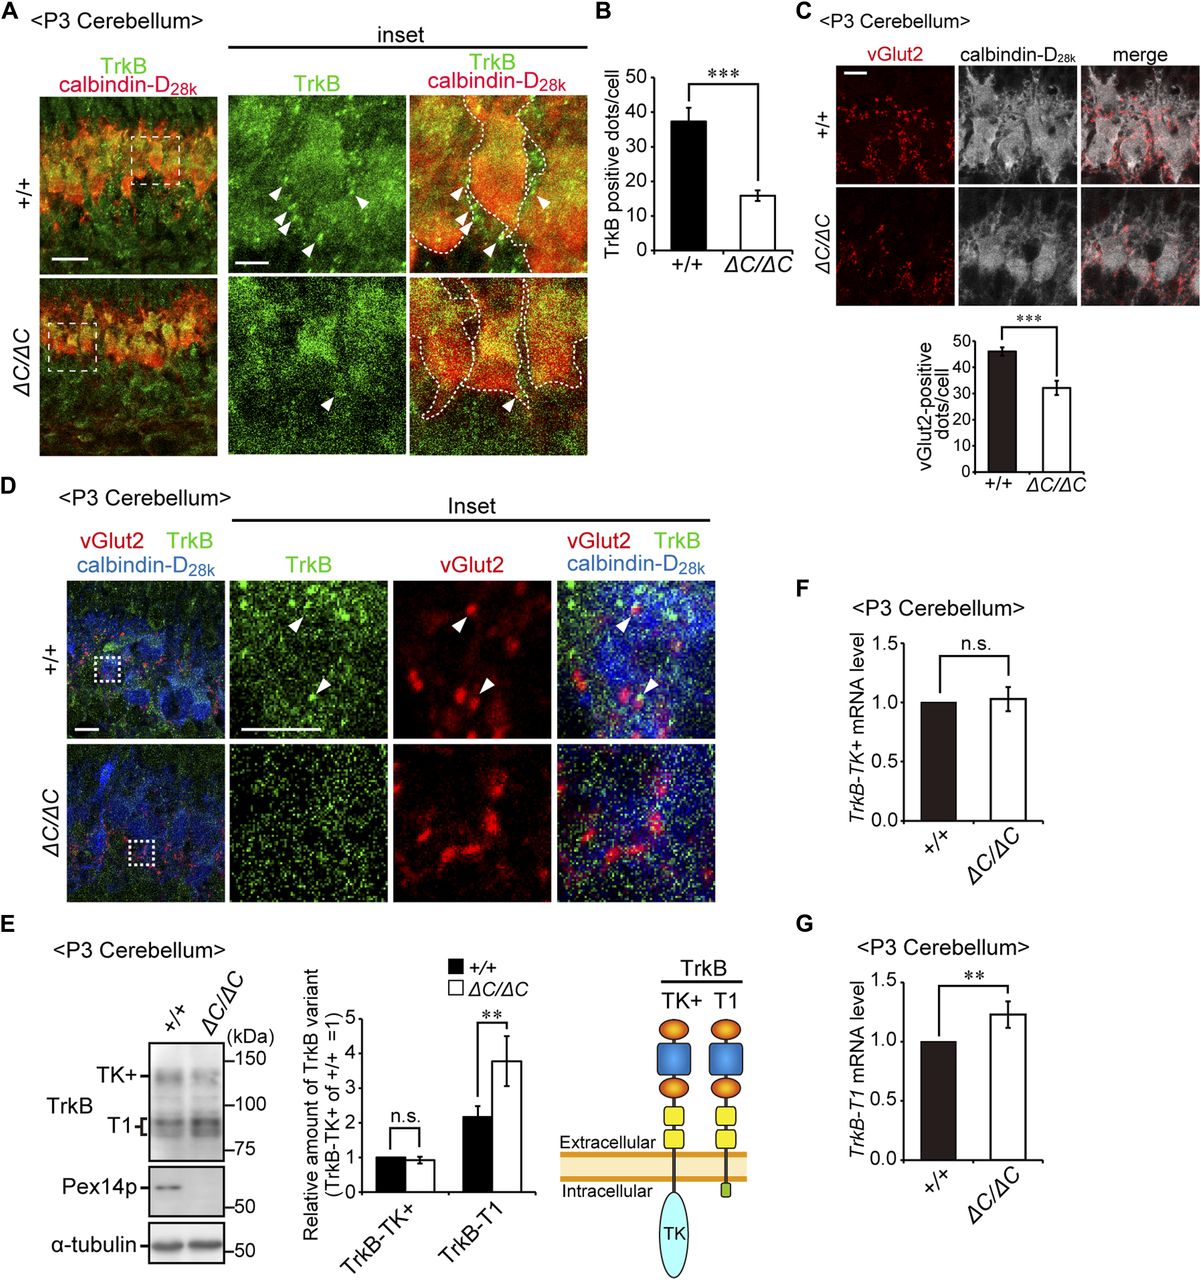
- Figure 6. TrkB-T1 is upregulated in cerebellum of Pex14ΔC/ΔC BL/ICR mouse at P3.
(A) Sagittal sections of the cerebellum from wild-type (+/+) and Pex14ΔC/ΔC (ΔC/ΔC) BL/ICR mice were labeled with anti-TrkB (green) and calbindin-D28k (red) antibodies. Scale bar, 20 μm. Higher magnification images of the boxed regions are shown and cell boundaries were indicated as a dashed line (inset). Scale bar, 5 μm. (B) TrkB-positive dots (arrowheads) were quantified (n = 13). (C) Sagittal sections of the cerebellum at P3 were stained with antibodies against vGlut2 (red) and calbindin-D28k (white). The number of dots stained with anti-vGlut2 antibody was quantified (lower panel, n = 4). Scale bar, 10 μm. (D) Sagittal sections of the cerebellum at P3 were stained with antibodies against TrkB (green), vGlut2 (red), and calbindin-D28k (blue). Scale bar, 10 μm. Higher magnification images of the boxed regions are shown (inset). Scale bar, 5 μm. Arrowheads indicate TrkB-positive punctate structures that partly coincided with or are located adjacent to vGlut2-positive punctate structures. (E) Cerebellum lysates were analyzed by SDS-PAGE and immunoblotting with antibodies against TrkB, Pex14pC, and α-tubulin (left panel). TrkB-TK+, full-length TrkB; TrkB-T1, a truncated isoform of TrkB. Amounts of TrkB-TK+ and TrkB-T1 are presented relative to those of TrkB-TK+ in the control mice (middle panel, n = 6). A schematic view of TrkB variants is shown on the right (right panel). TK, tyrosine kinase domain. (F, G) mRNA levels of TrkB-TK+ (F) and TrkB-T1 (G) were quantified by real-time PCR (n = 6). ns, not significant, **P < 0.01, ***P < 0.001, by t test (B, C, E–G).
Source data are available for this figure.
Source Data for Figure 6[LSA-2018-00062_SdataF1.pdf]
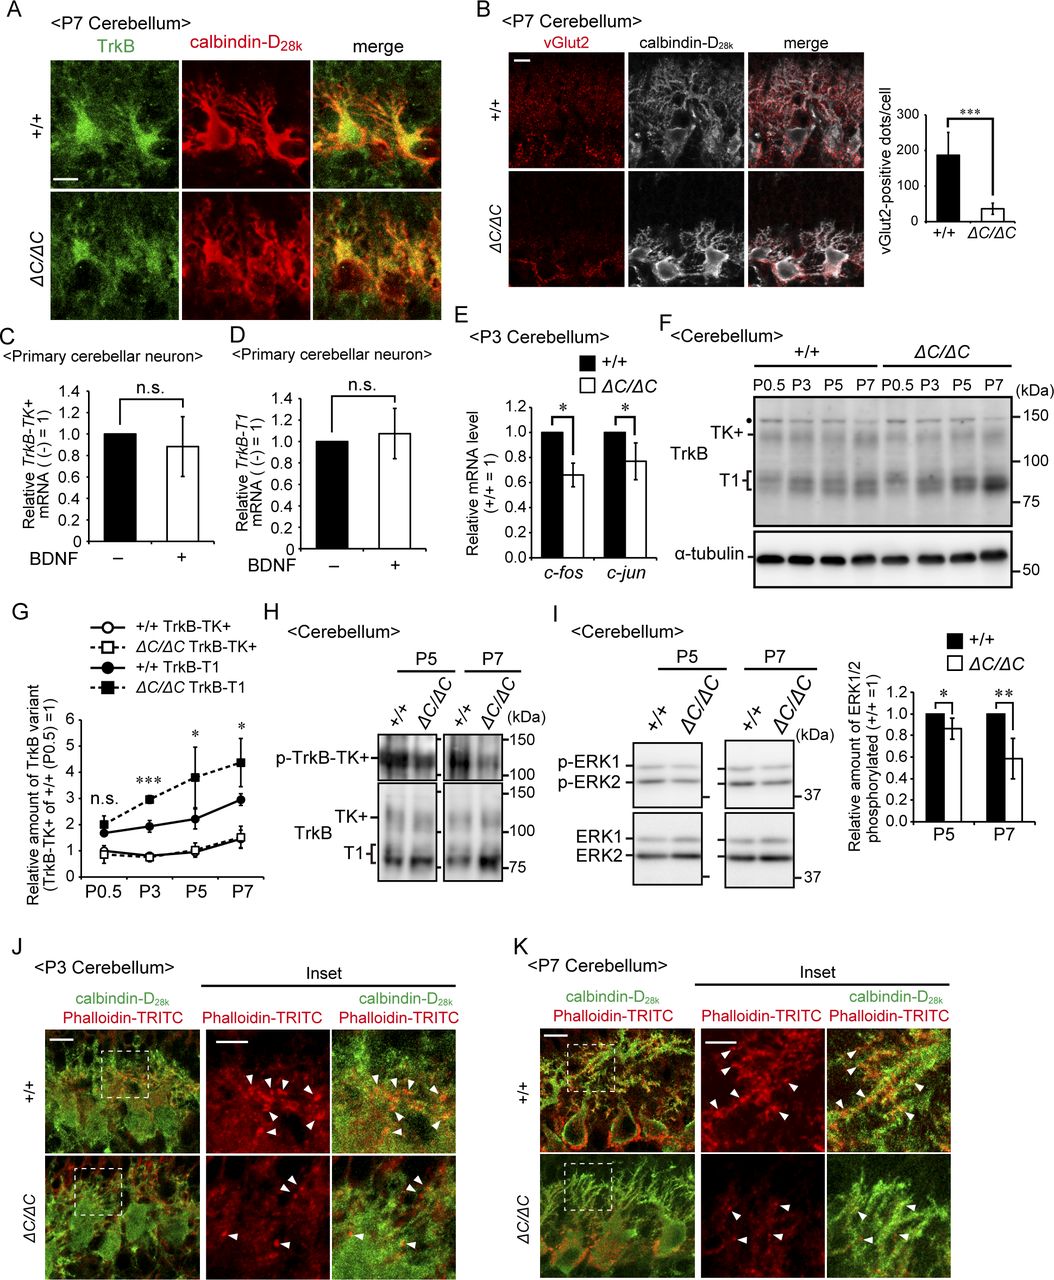
- Figure S3. Impaired TrkB signaling in the cerebellum of Pex14ΔC/ΔC BL/ICR mice.
(A) Sagittal sections of the cerebellum of wild-type (+/+) and Pex14ΔC/ΔC (ΔC/ΔC) BL/ICR mice at P7 were stained with anti-TrkB (green) and calbindin-D28k (red) antibodies. TrkB-positive punctate structures that were observed at P3 (Fig 6A) were not detected in the wild-type mouse cerebellum at P7, suggesting that climbing fiber terminals shifted to the Purkinje cell dendritic compartment. Scale bar, 10 μm. (B) Sagittal sections of the cerebellum at P7 were stained with antibodies against vGlut2 (red) and calbindin-D28k (white). The number of dots stained with anti-vGlut2 antibody was quantified (right panel, n = 4). Scale bar, 10 μm. (C, D) Primary cerebellar neurons from a wild-type mouse at P0.5 were cultured for five DIV and then treated with 50 ng/ml BDNF for two DIV. Levels of TrkB-TK+ (C) and TrkB-T1 (D) mRNAs were determined by real-time PCR (n = 5). (E) Relative mRNA levels of c-fos and c-jun in the cerebellum at P3 were analyzed by real-time PCR (n = 3). (F) Cerebellar lysates of wild-type and Pex14ΔC/ΔC BL/ICR mice at P0.5, P3, P5, and P7 were analyzed as in Fig 6E. TrkB-TK+, full-length TrkB; TrkB-T1, truncated isoform of TrkB; Dot, a non-specific band. (G) Amounts of TrkB-TK+ and TrkB-T1 were normalized by α-tubulin level and presented relative to those of TrkB-TK+ in control mice at P0.5 (n = 3). (H) Cerebellum lysates from wild-type and Pex14ΔC/ΔC BL/ICR mice at P5 and P7 were analyzed by SDS–PAGE and immunoblotting with antibodies against TrkB (lower panels) and phosphorylated Trk (p-TrkB-TK+, Y496, upper panels). (I) Total ERK1/2 (lower panels) and phosphorylated ERK1/2 (p-ERK1 and 2, T202, and Y204, respectively, upper panels) at P5 and P7 were analyzed as in Fig 7C. The amount of phosphorylated ERK1/2 relative to total ERK1/2 is represented (P5; n = 3, P7; n = 4). (J, K) Sagittal sections of the cerebellum from wild-type (upper panels) and Pex14ΔC/ΔC (lower panels) BL/ICR mice at P3 (J) and P7 (K) were stained with anti-calbindin-D28k antibody (green) and phalloidin-TRITC (red). Scale bar, 10 μm. Higher magnification images of the boxed regions are shown (inset). Scale bar, 5 μm. Actin-positive structures located on the dendrites (arrowheads) were decreased in Pex14ΔC/ΔC BL/ICR mice. ns, not significant, *P < 0.05, ***P < 0.001, by t test (B, C–E, G, and I).
Source data are available for this figure.
Source Data for Figure S3[LSA-2018-00062_SdataF1.pdf]
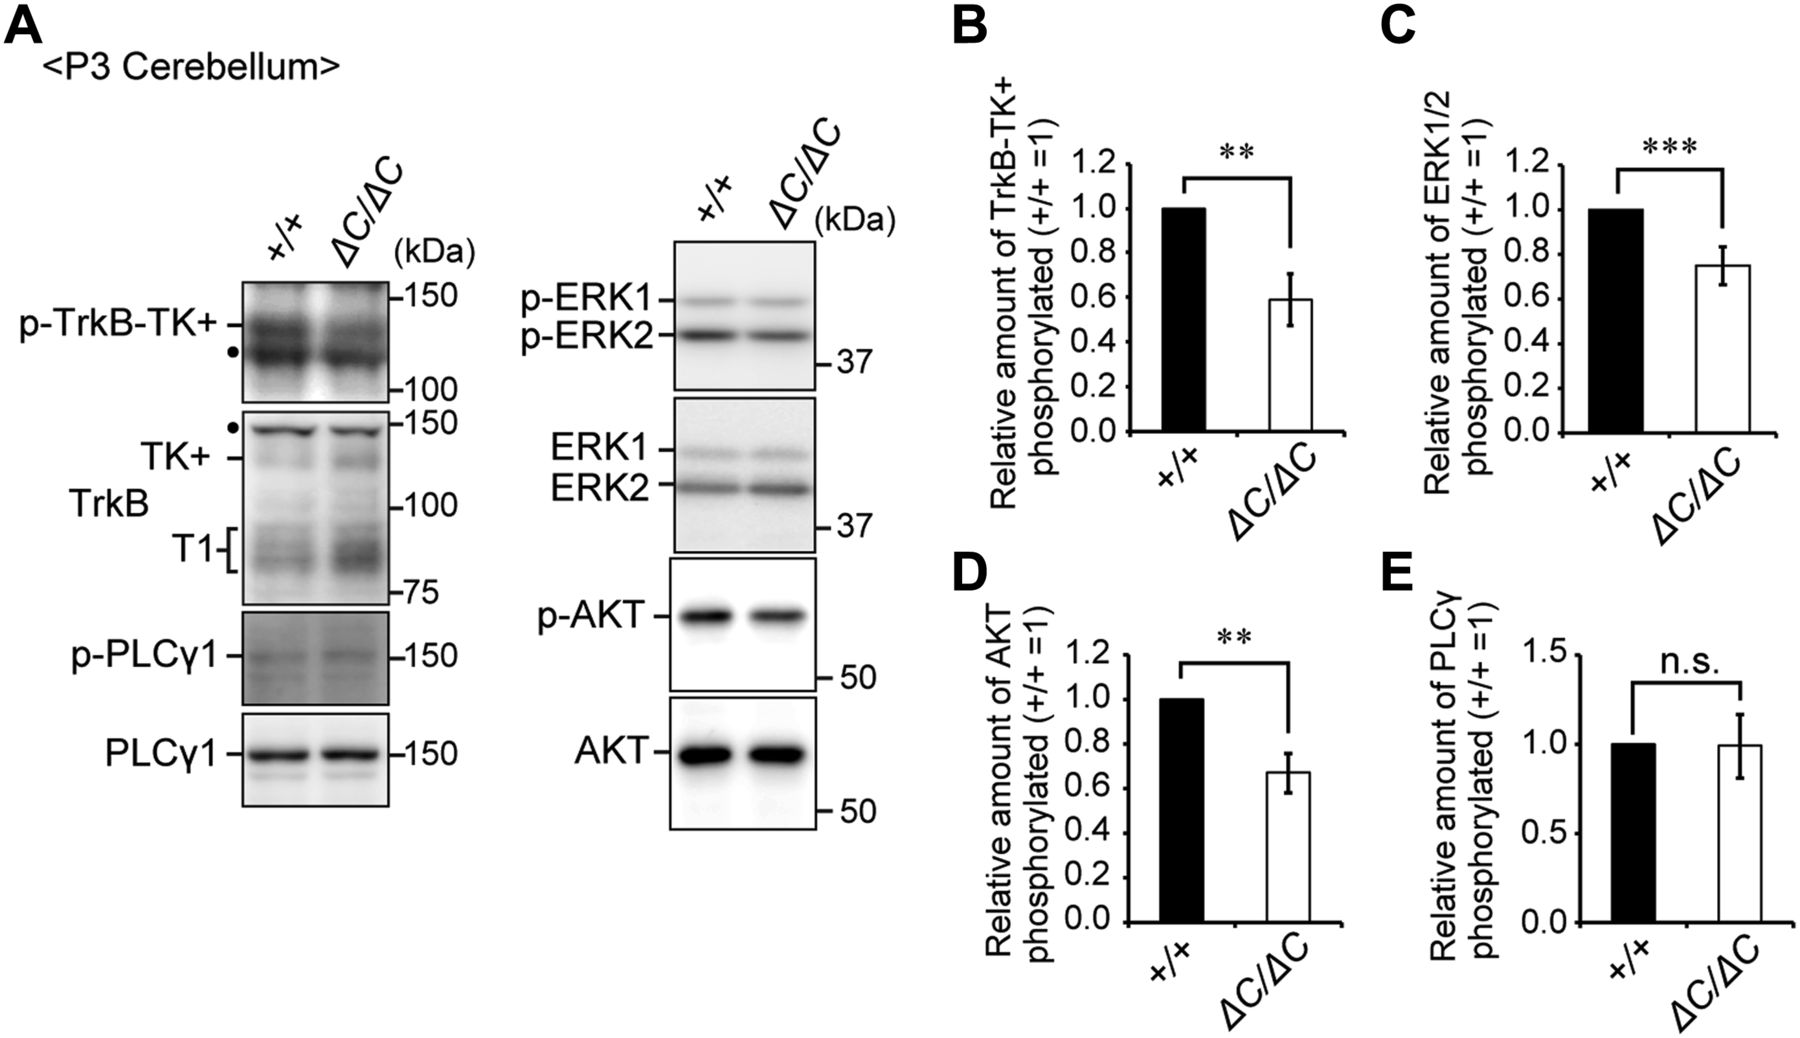
- Figure 7. The BDNF-TrkB signaling pathway is impaired in the cerebellum of Pex14ΔC/ΔC BL/ICR mice at P3.
(A) Cerebellum lysates from wild-type (+/+) and Pex14ΔC/ΔC (ΔC/ΔC) BL/ICR mice were analyzed by SDS–PAGE and immunoblotting with antibodies against TrkB, phosphorylated Trk (p-TrkB-TK+, Y496), PLCγ1, phosphorylated PLCγ1 (p-PLCγ1, Y783), ERK, phosphorylated ERK (p-ERK1 and 2, T202 and Y204, respectively), AKT, and phosphorylated AKT (p-AKT, S473). Dots, non-specific bands. (B–E) The amount of phosphorylated TrkB-TK+ to total TrkB-TK+ (B), phosphorylated ERK1/2 relative to total ERK1/2 (C), phosphorylated AKT to total AKT (D), and phosphorylated PLCγ1 to total PLCγ1 (E) were represented (n = 3). ns, not significant, **P < 0.01, ***P < 0.001, by t test (B–E).
Source data are available for this figure.
Source Data for Figure 7[LSA-2018-00062_SdataF1.pdf]
- Figure 8. BDNF expression in the cerebellum and brain stem region.
(A) mRNA levels of Bdnf and Nt-4 relative to those of Rpl13a in the cerebellum from wild-type (+/+) and Pex14ΔC/ΔC (ΔC/ΔC) BL/ICR mice at P3 were determined by real-time PCR (n = 4). (B) Sagittal sections of the cerebellum at P7 were stained with antibodies to GFAP (green) and BDNF (red). Merged views of the two different proteins and staining with Hoechst 33242 (blue) are shown. Scale bar, 20 μm. (C) In situ hybridization analysis of Bdnf mRNA in the brain stem region of wild-type (upper panels) and Pex14ΔC/ΔC (lower panels) mice at P0.5. Arrows indicate ION. Insets are higher magnification images of the dashed-line boxed regions. Scale bar, 100 μm. (D) Relative intensity of Bdnf mRNA staining by in situ hybridization shown in C was presented (n = 3). (E) Sagittal sections of the brain stem at P3 were stained with anti-BDNF antibody (red) and Hoechst 33242 (blue). Scale bar, 20 μm. (F) Fluorescent intensity of BDNF staining on the ION shown in E was quantified (n = 3). (G) The mRNA level of Bdnf in the brain stem region was quantified by real-time PCR (n = 3). (H) Brain stem lysates were analyzed by SDS–PAGE and immunoblotting using antibodies against BDNF and α-tubulin. The BDNF band was quantified (lower panel, n = 4). ns, not significant, *P < 0.05, **P < 0.01, by t test (A, D, F–H).
Source data are available for this figure.
Source Data for Figure 8[LSA-2018-00062_SdataF1.pdf]
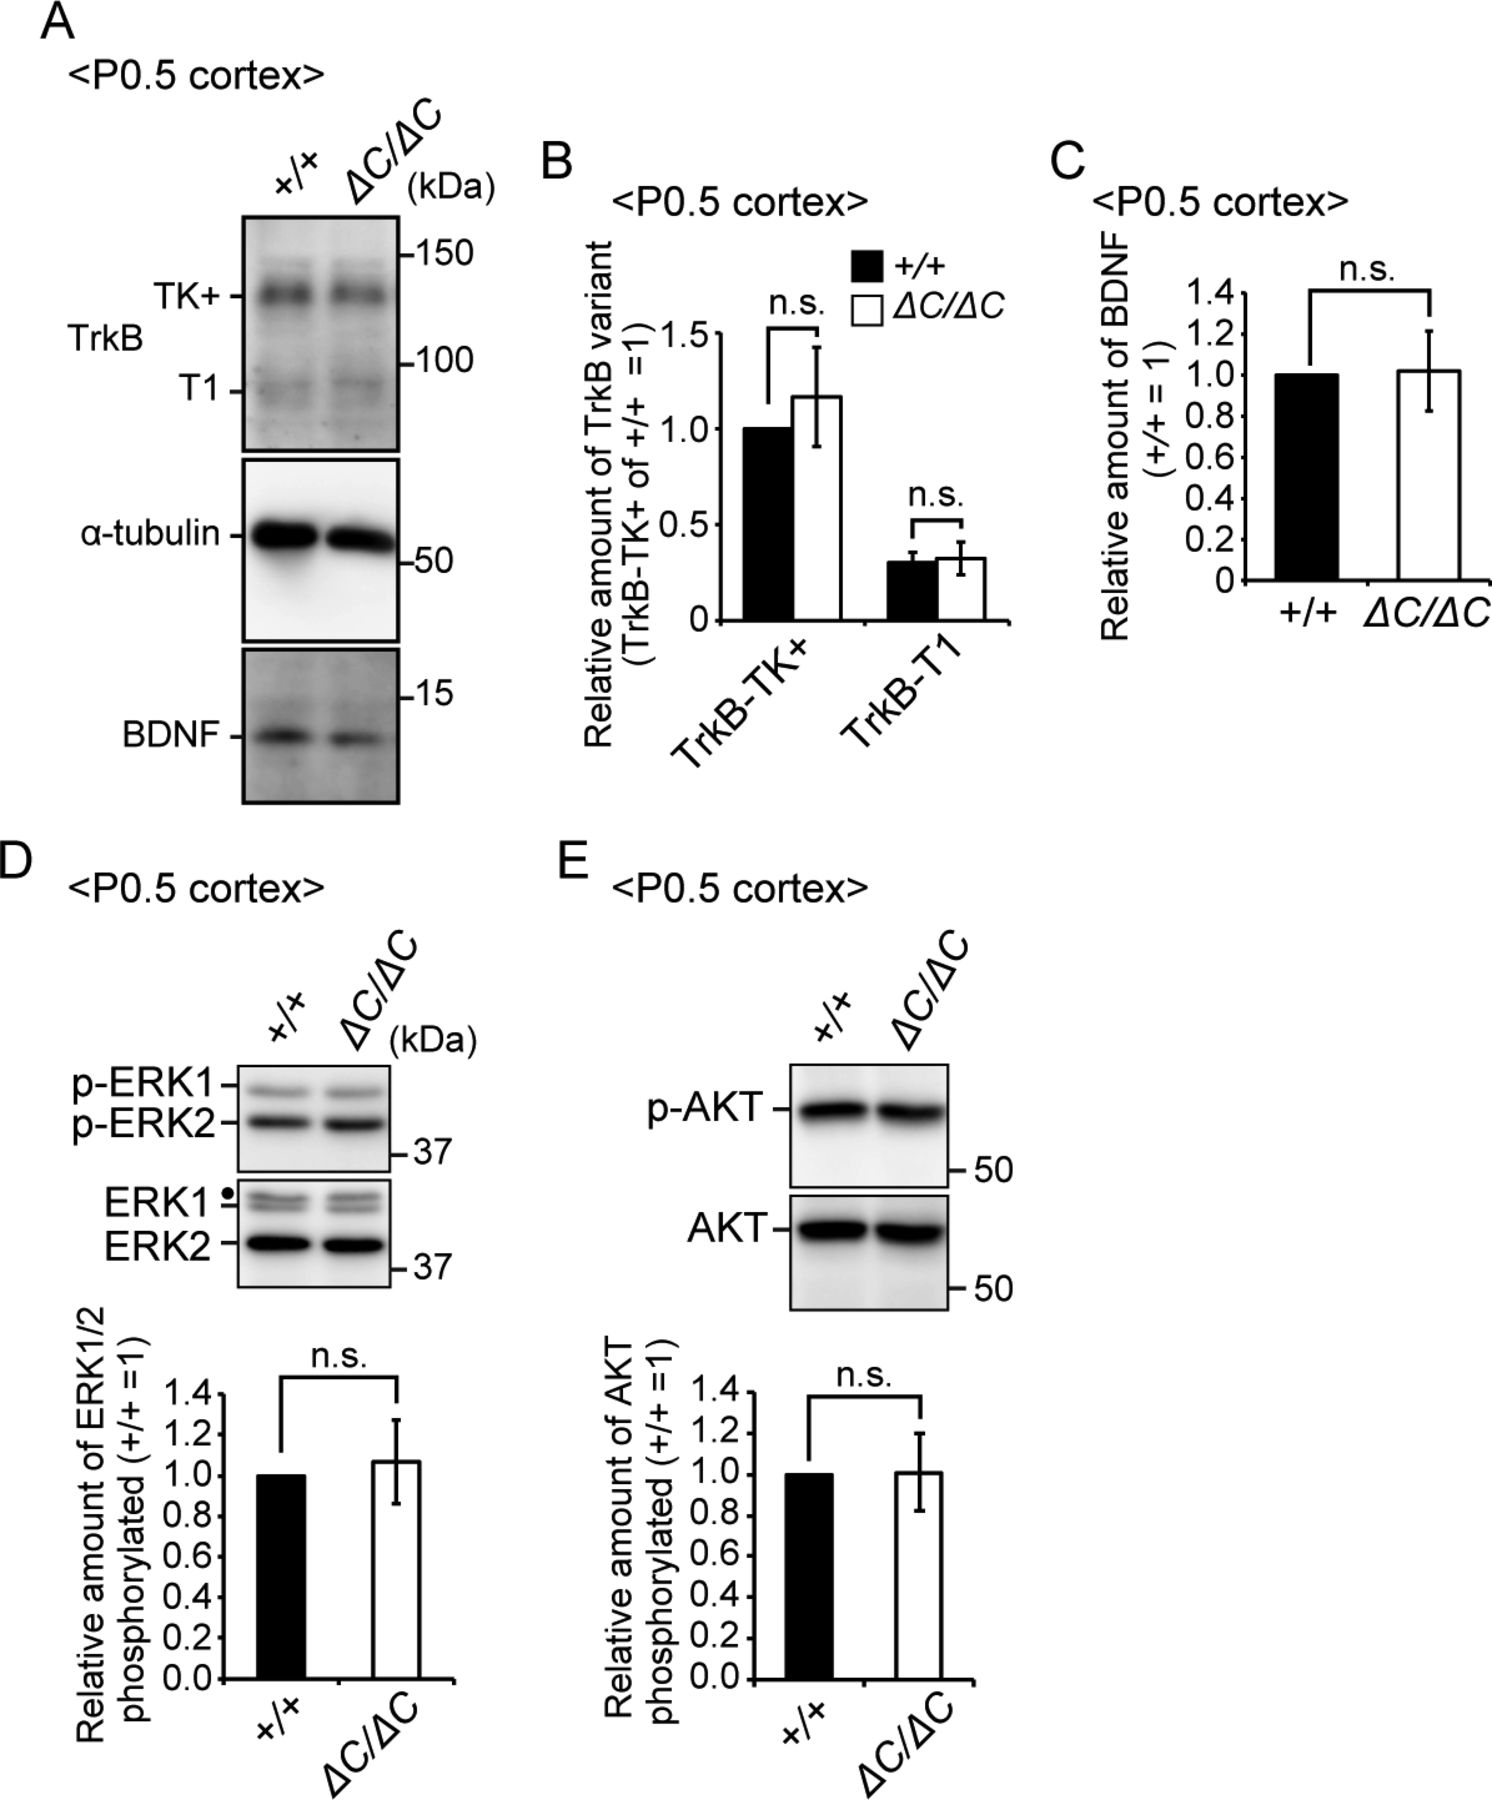
- Figure S4. Expressions of TrkB and BDNF were not altered in the cortex of Pex14ΔC/ΔC mice.
(A) Lysates of the cortex from wild-type and Pex14ΔC/ΔC mice at P0.5 were analyzed by SDS–PAGE and immunoblotting with antibodies against TrkB, α-tubulin, and BDNF. (B) Amounts of TrkB-TK+ and TrkB-T1 were normalized by α-tubulin level and presented relative to those of TrkB-TK+ in wild-type mice at P0.5 (n = 4). (C) Amount of BDNF was normalized by α-tubulin level and presented relative to that in wild-type mice at P0.5 (n = 4). (D, E) Lysates of the cortex from wild-type and Pex14ΔC/ΔC mice at P0.5 were analyzed as in (A) with antibodies against ERK (D), phosphorylated ERK (p-ERK1 and 2, T202, and Y204, respectively) (D), AKT (E), and phosphorylated AKT (p-AKT, S473) (E). Amounts of phosphorylated ERK1/2 relative to total ERK1/2 (D) and phosphorylated AKT to total AKT (E) were shown on the respective lower panels (n = 4). Dot, a non-specific band. ns, not significant, by t test (B–E).
Source data are available for this figure.
Source Data for Figure S4[LSA-2018-00062_SdataF1.pdf]
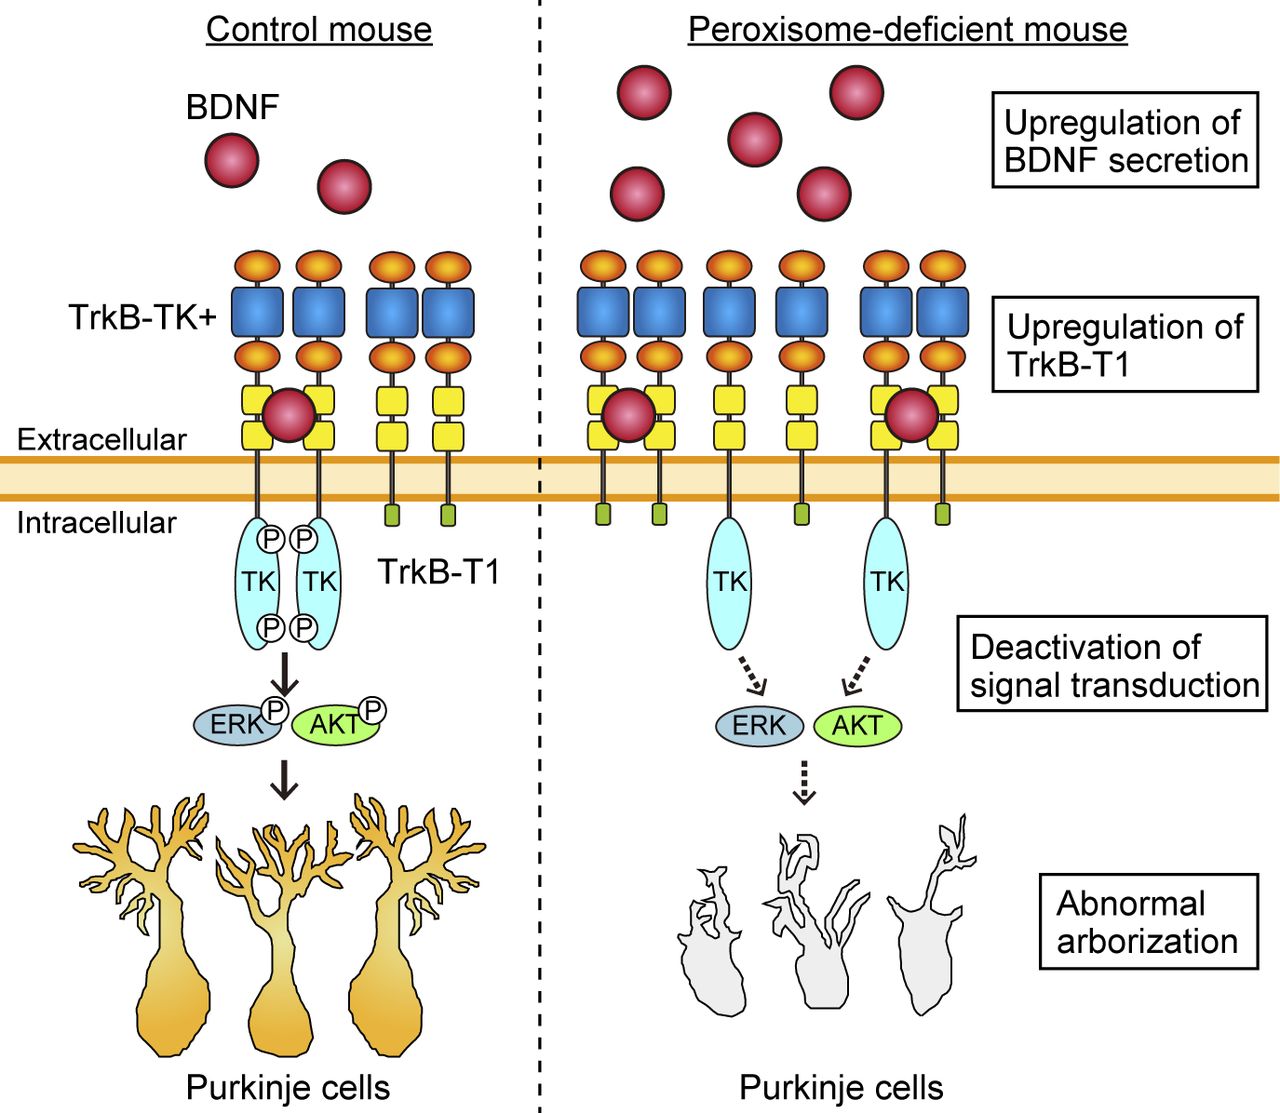
- Figure S5. A schematic model of dysmorphogenesis of Purkinje cells in the Pex14ΔC/ΔC mouse.
In the wild-type cerebellum (left), BDNF targets to TrkB-TK+ on the surface of Purkinje cells. The cytosolic tyrosine kinase domain (TK) then undergoes autophosphorylation and activates MAPK/ERK and PI3K/AKT signaling, leading to the dendritic arborization of Purkinje cells. In the Pex14ΔC/ΔC mouse, the BDNF level is increased around the Purkinje cells through the climbing fiber from ION neurons. On the Purkinje cells of the Pex14ΔC/ΔC mouse (right), TrkB-T1 is up-regulated and dominant-negatively inhibits autophosphorylation of TrkB-TK+. Decrease of TrkB-TK+ phosphorylation deactivates the MAPK/ERK and PI3K/AKT signaling, resulting in the dysmorphogenesis of Purkinje cells.


Supplementary Materials


