


Article Figures & Data
Figures
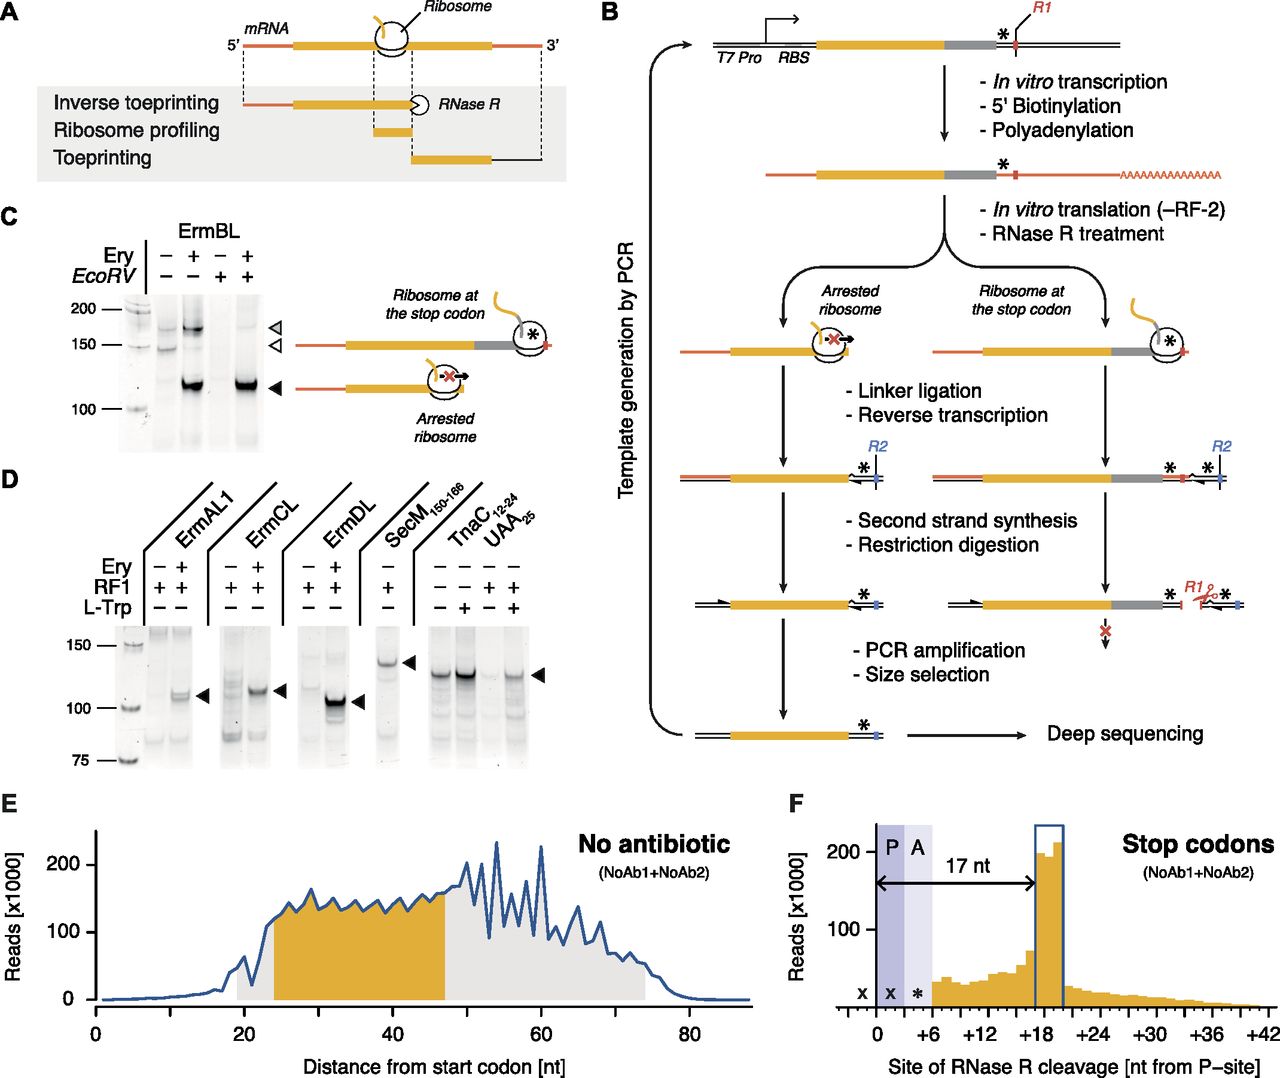
- Figure 1. Inverse toeprinting locates ribosomes on the mRNA with codon resolution.
(A) Comparison between inverse toeprinting, ribosome profiling, and classical toeprinting. (B) Schematic overview of the inverse toeprinting workflow. Restriction enzymes used in odd (EcoRV) and even (ApoI) cycles are shown in red and blue, respectively. Stop codons are indicated as asterisks. (C) Removal of inverse toeprints featuring ribosomes that have reached the stop codon on the ermBL template (white triangle) using the EcoRV restriction enzyme. The black triangle corresponds to arrested ribosomes and the gray triangle to full-length mRNA. (D) Inverse toeprints for various Erm peptides in the absence or presence of Ery, SecM150–166, and TnaC12–24UAA25. The wild-type UGA25 stop codon for TnaC was replaced with a UAA25 stop codon, allowing its release by RF-1. (E) Size distribution of inverse toeprints from two biological replicates (NoAb1 and NoAb2) with a minimum Q-score of 30 obtained from an NNS15 library translated in the absence of any added antibiotic. The fragment size range shaded in gray corresponds to the band that was cut from a 12% TBE-acrylamide gel, whereas the range in yellow indicates fragments that were used in the subsequent analysis. (F) Analysis of inverse toeprints containing stop codons that were obtained in the absence of antibiotic reveals that RNase R cleaves +17 nucleotides downstream from the P-site.
- Figure S1. Overview of the inverse toeprinting workflow.
(A) Step-by-step description of the inverse toeprinting methodology. Restriction enzymes used in odd (EcoRV) and even (ApoI) cycles are shown in red and blue, respectively. Stop codons are indicated as asterisks. (B) Efficiency of ermBL mRNA biotinylation measured using a dot blot assay. The standard used is a synthetic biotinylated oligonucleotide, which corresponds to 100% biotinylation efficiency. (C) Efficiency of polyadenylation and digestion by RNase R. The light blue arrow indicates untreated ermBL mRNA and the yellow arrow indicates polyadenylated ermBL mRNA. (D) Amplification of ermBL toeprints following one, two, or three rounds of inverse toeprinting in the presence of Ery.
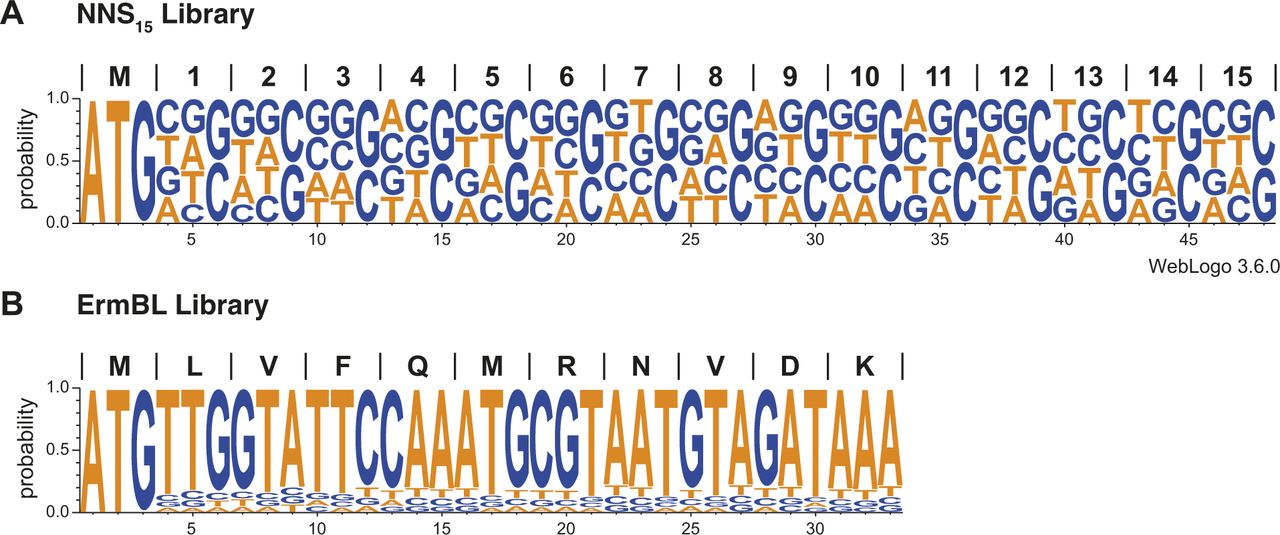
- Figure S2. DNA template libraries used for inverse toeprinting.
WebLogos (Schneider & Stephens, 1990; Crooks et al, 2004) obtained from 100,000 randomly chosen sequenced reads for the (A) NNS15 and (B) ErmBL libraries.
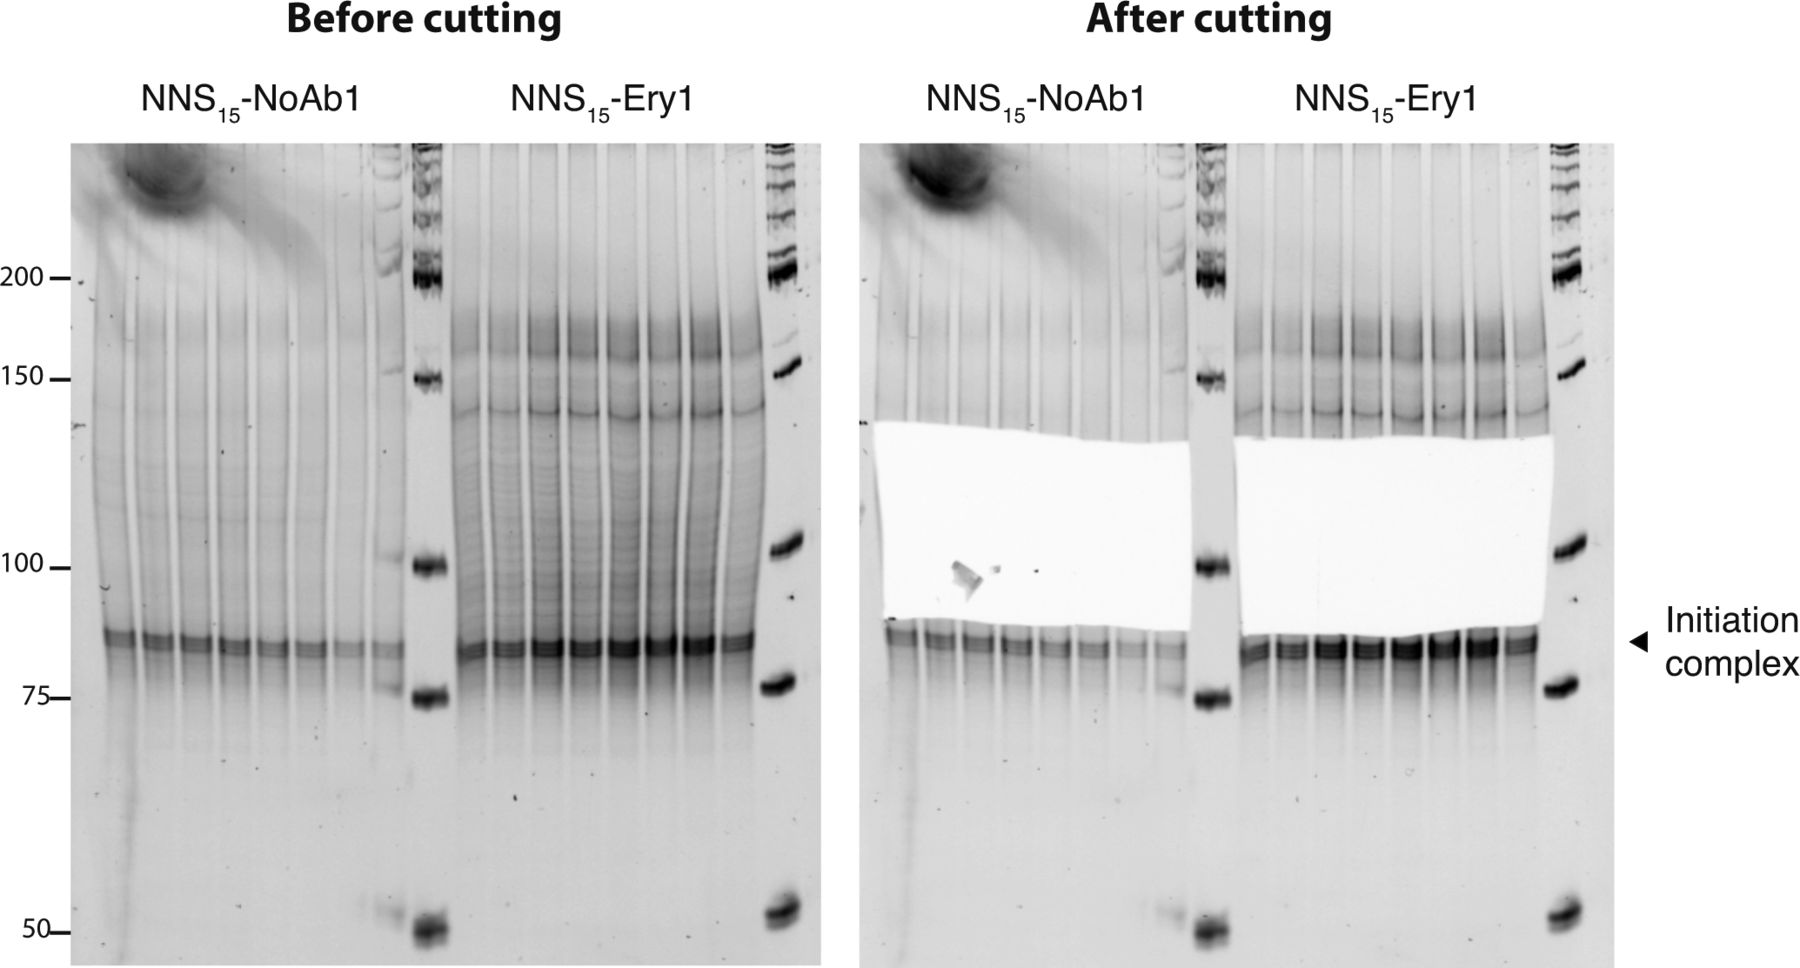
- Figure S3. Excision of inverse toeprints from a polyacrylamide gel.
cDNA obtained from inverse toeprints was amplified by PCR after second strand synthesis and EcoRV treatment and loaded onto a 12% acrylamide TBE gel stained with SyBR Gold. The band indicated by a black triangle corresponds to inverse toeprints of ribosomes stalled at the initiation codon. Amplified double stranded cDNA corresponding to ∼90–135 bp was excised from the gel with a clean scalpel to retain inverse toeprints where ribosomes had stalled after translating 2–15 codons. cDNA was eluted from the gel by diffusion as described in the methods section.
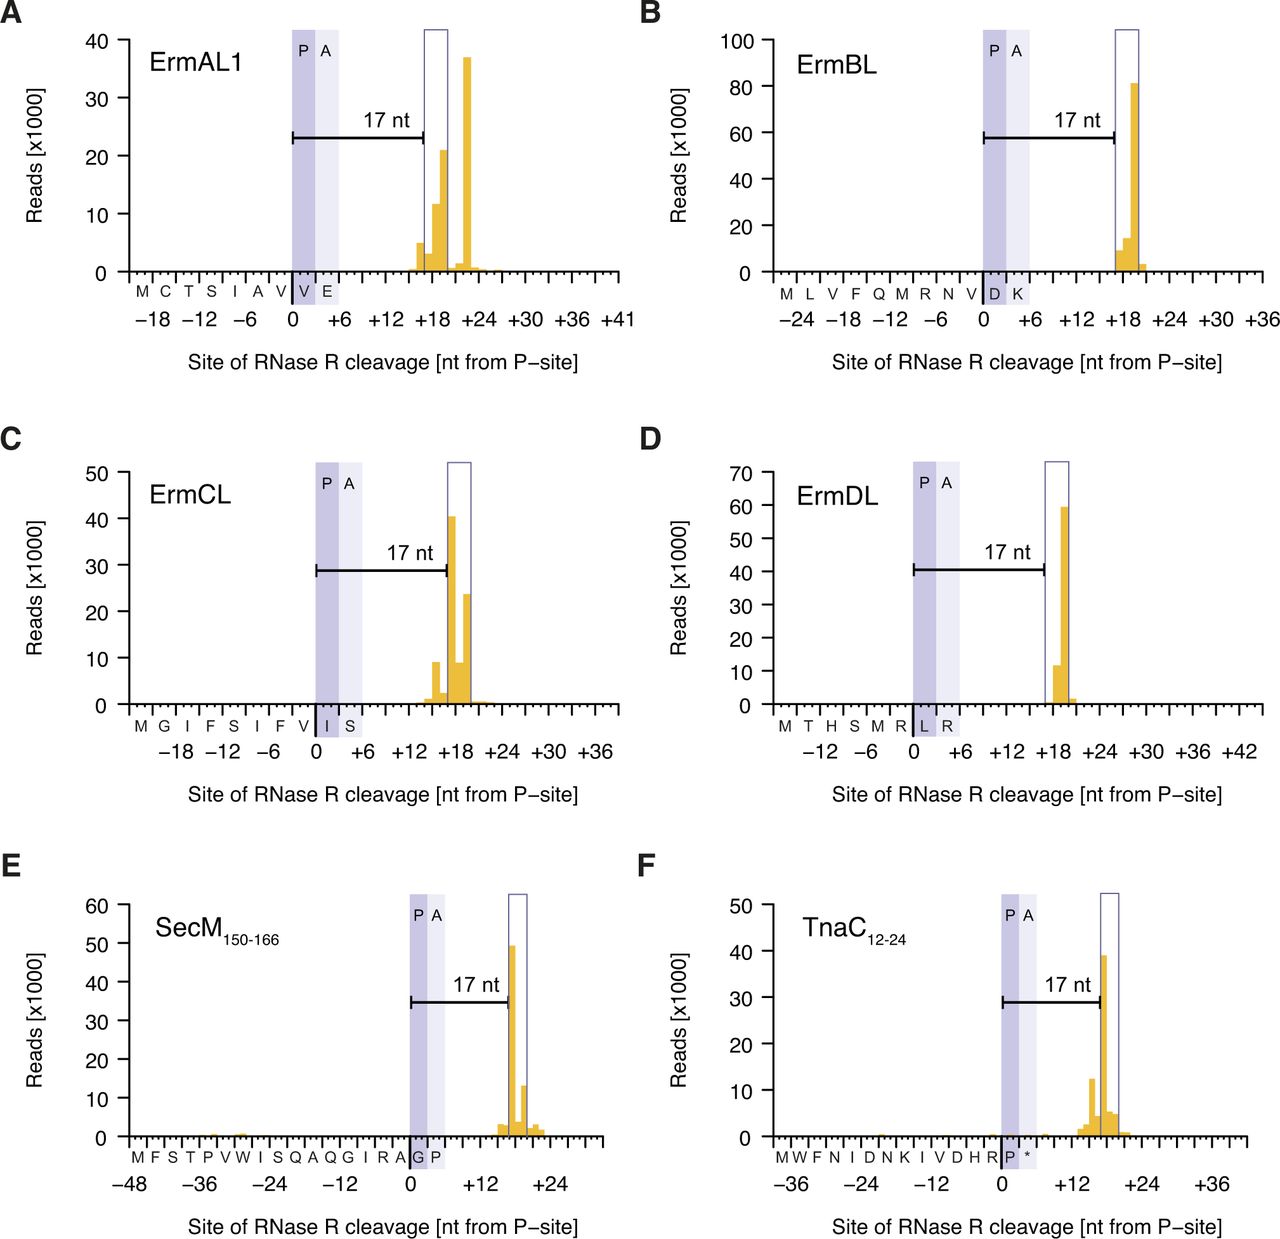
- Figure S4. Inverse toeprints obtained for various known arrest sequences.
The distance between the documented point of arrest and the site of cleavage by RNase R is shown for the known arrest peptides ErmAL1 (A), ErmBL (B), ErmCL (C), ErmDL (D), SecM150–166 (E), and TnaC12–24UAA25 (F). Note that ErmAL1 appears to feature a previously unidentified second arrest site.
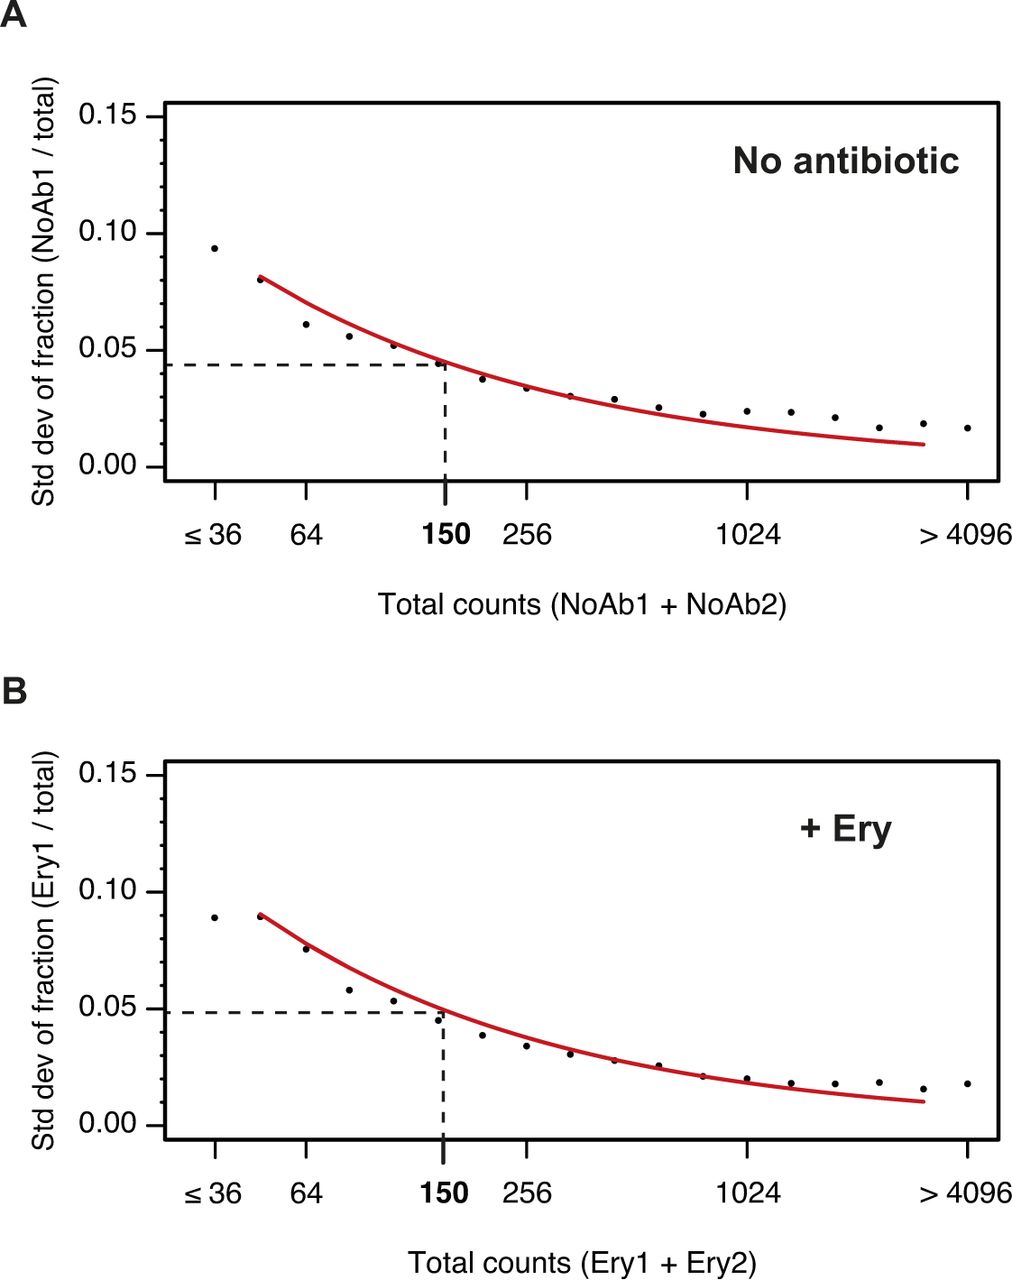
- Figure S5. Impact of counting statistics on the quantification of errors between replicates.
The reproducibility of inverse toeprinting was assessed using fully independent biological replicates. For each 3-aa motif, the fraction of the total number of reads between replicates that originated from replicates (A) NoAb1 and (B) Ery1 was calculated and binned according to the total number of reads. The SD of these fractions was calculated and plotted for each bin, as indicated by black points. The red curve indicates predicted SDs obtained using the same number of total reads for each bin, which had been randomly partitioned into two replicates for each sample, according to probabilities that were proportional to the total number of reads in each replicate. The close match between the predicted and measured SDs indicates that counting statistics are the main source of error. A threshold of 150 reads was chosen as the point where the SD drops below 0.05.
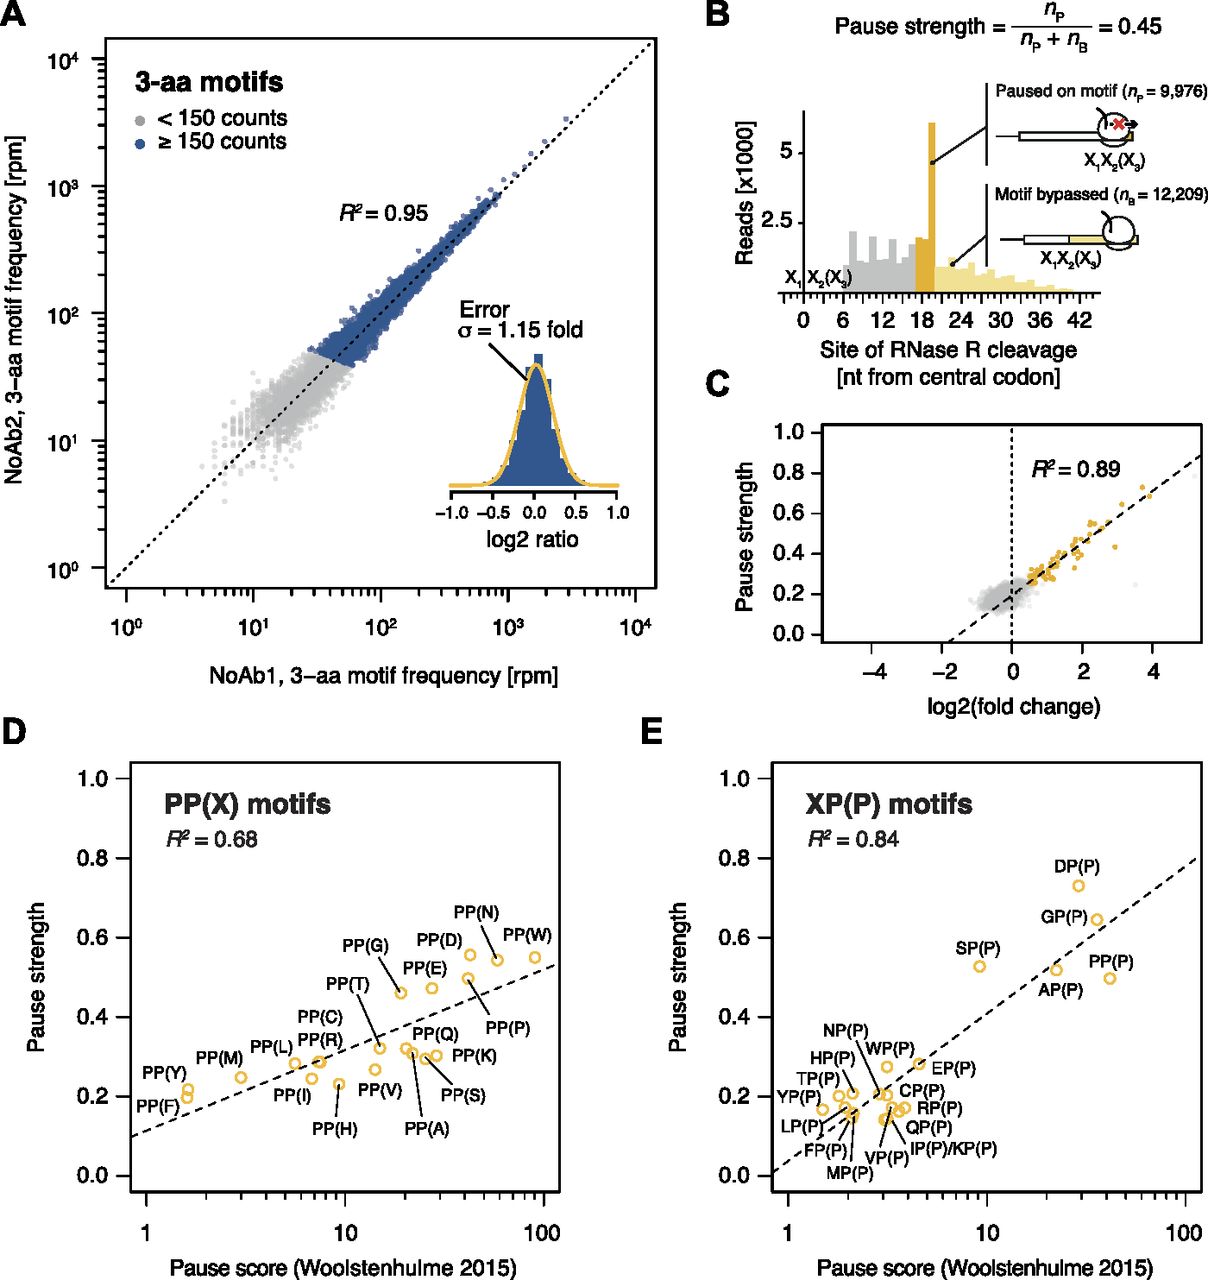
- Figure 2. Motif pause strength correlates with enrichment on inverse toeprinting.
(A) 3-aa motif frequencies in reads per million (rpm) from two independent inverse toeprinting experiments performed after translation in the absence of antibiotic (NoAb1 and NoAb2). The inset represents a histogram of log2 ratios between replicates for 3-aa motifs having low statistical counting error (i.e., with >150 counts [blue], Fig S5), with an overlaid normal error curve (mean = 0.02, SD = 0.2 log2 units, equivalent to σ = 1.15 fold). (B) Formula used to calculate pause strength for an X1X2(X3) motif, with the amino acid in the ribosomal A-site in brackets. (C) Plot of pause strength against log2 (fold change) of all possible 3-aa motif frequencies relative to the NNS15 library. Yellow points correspond to intrinsic 3-aa pause motifs with a pause strength ≥0.25. All other motifs are shown as gray dots. (D, E) Plot of pause strengths calculated in this study against pause scores calculated from ribosome profiling data obtained from E. coli cells lacking EF-P, for (D) PP(X) and (E) XP(P) motifs (Woolstenhulme et al, 2015). The scores obtained by both methods are strongly correlated, as indicated by R2 values of 0.68 and 0.84 for PP(X) and XP(P) motifs, respectively.
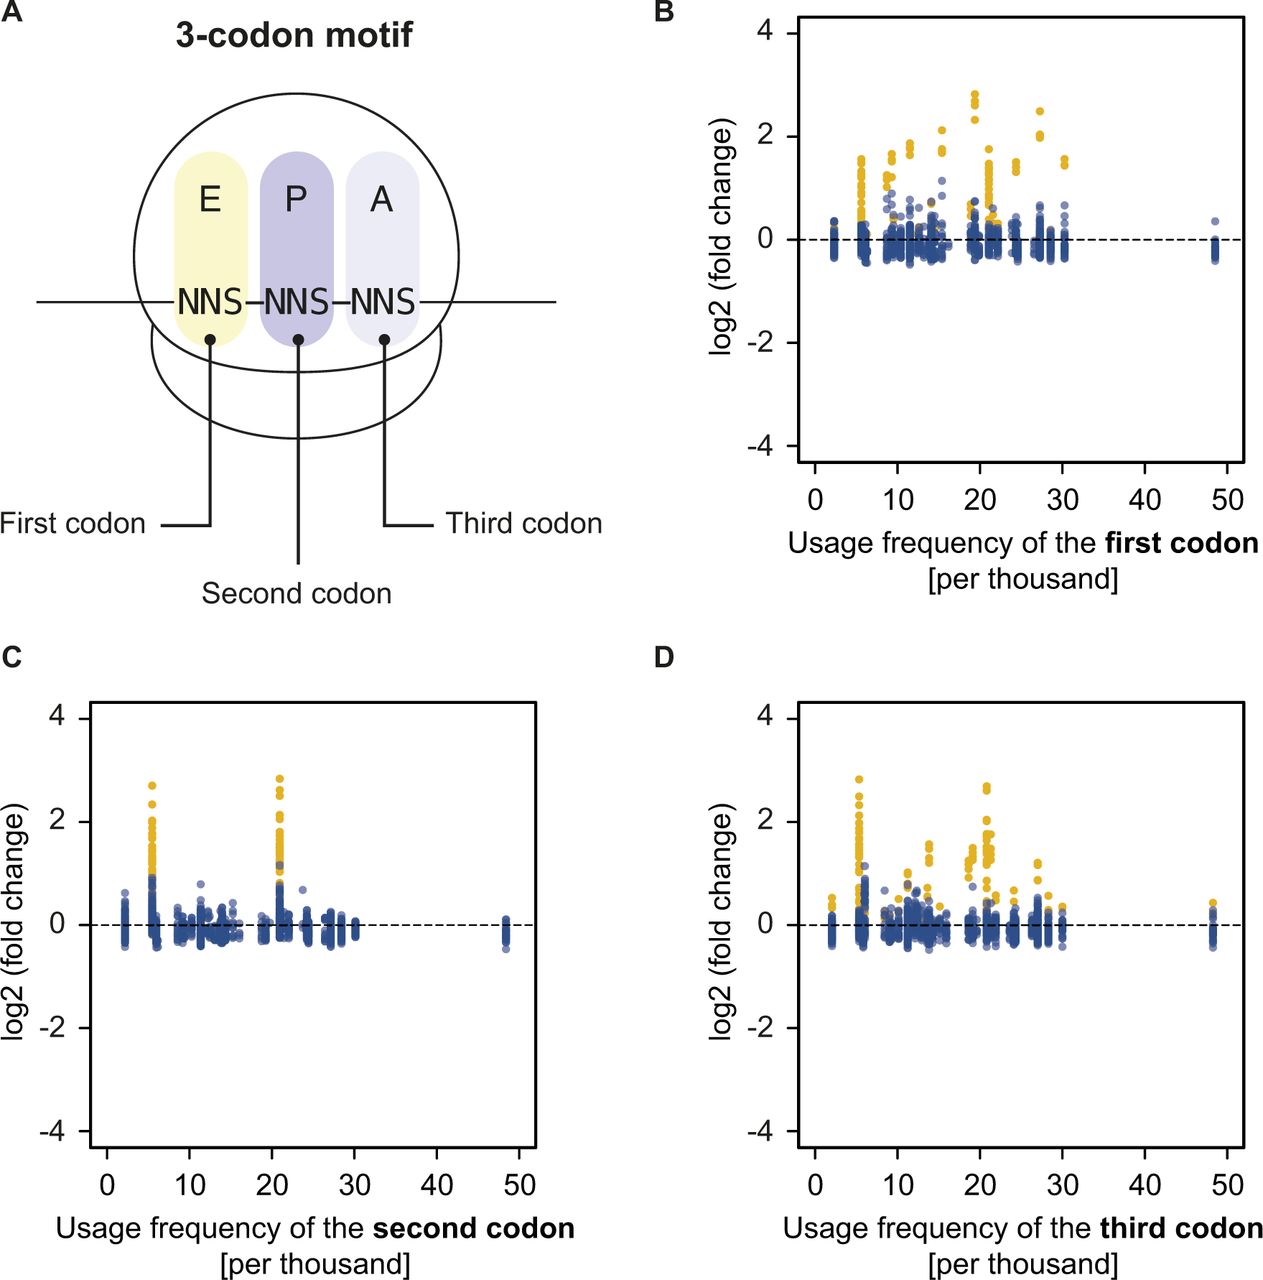
- Figure S6. Motif enrichment and codon usage are not correlated.
(A) Definition of a 3-codon motif within the NNS15 library. (B–D) Plots of the log2 (fold change) in frequency of well-measured three-codon motifs for the NoAb sample against the E. coli usage frequency of the (B) first, (C) second, or (D) third codon of each motif. PP(X) or XP(P) motifs that are enriched because of peptide-dependent pausing are shown in yellow. All other motifs are shown in blue and their enrichment is not correlated with codon usage.
- Figure S7. Size distribution of inverse toeprints obtained in the presence of Ery.
Size distribution of inverse toeprints from two biological replicates with a minimum Q-score of 30 obtained from an NNS15 library translated in the presence of Ery (Ery1 + Ery2). The fragment size range shaded in gray corresponds to the bands that were cut from a 12% TBE-acrylamide gel, whereas the range in yellow indicates fragments used in our analysis.
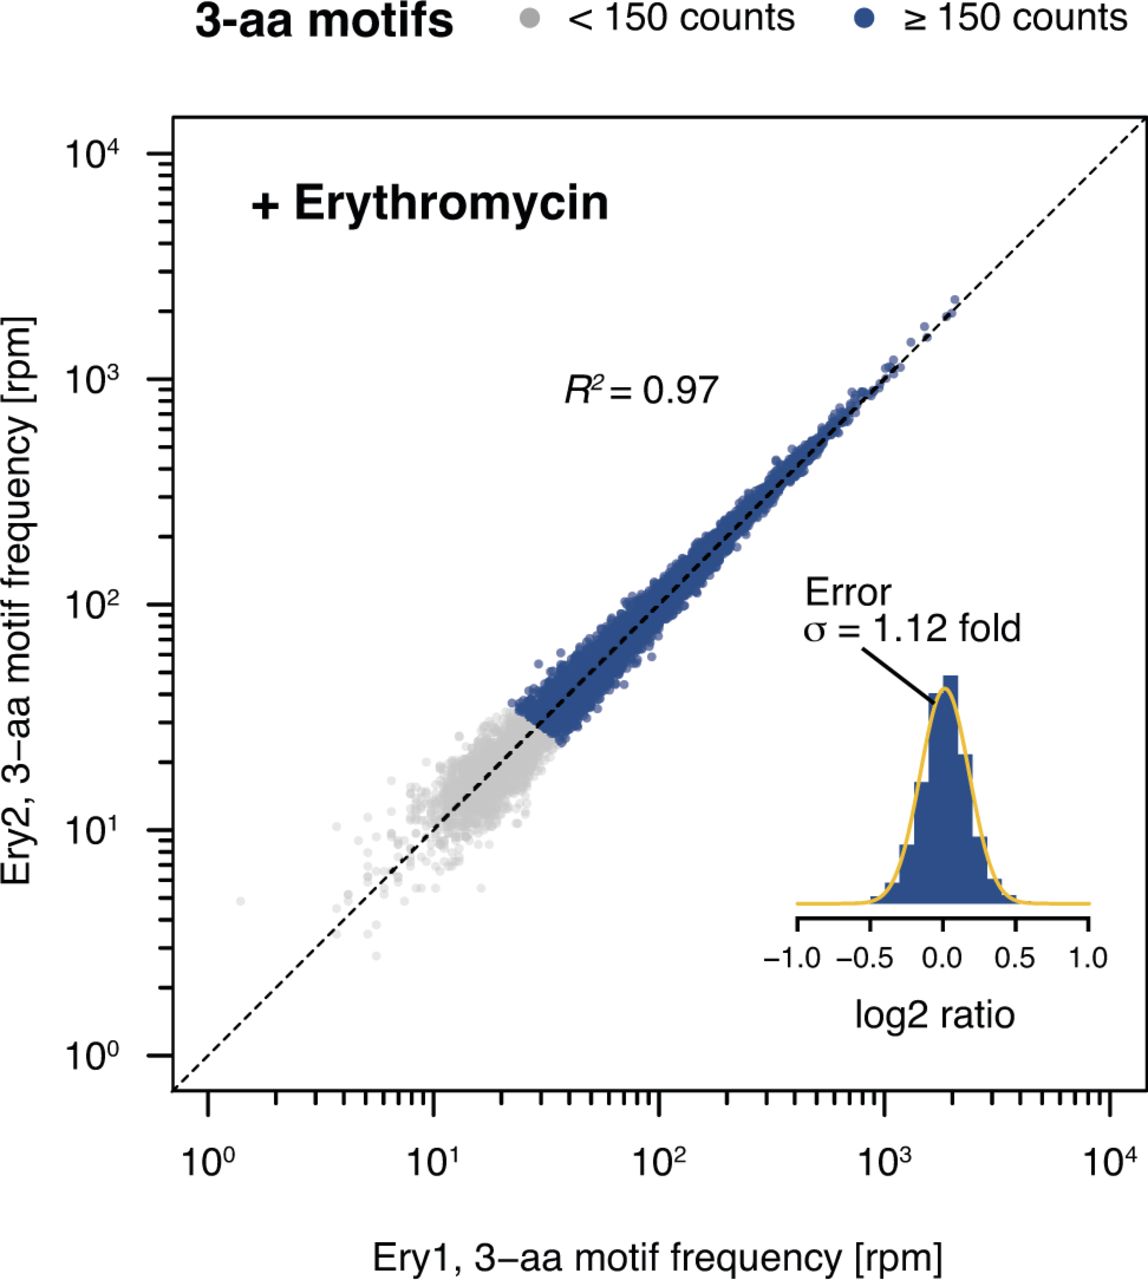
- Figure S8. Comparison of biological replicates for Ery-treated samples.
3-aa motif frequencies in two biological replicates obtained in the presence of Ery (Ery1 and Ery2). The inset represents a histogram of log2 ratios between replicates for 3-aa motifs having low statistical counting error (i.e., with >150 counts [blue], Fig S5) with an overlaid normal error curve (mean = 0.01, SD = 0.17 log2 units, equivalent to σ = 1.12 fold).
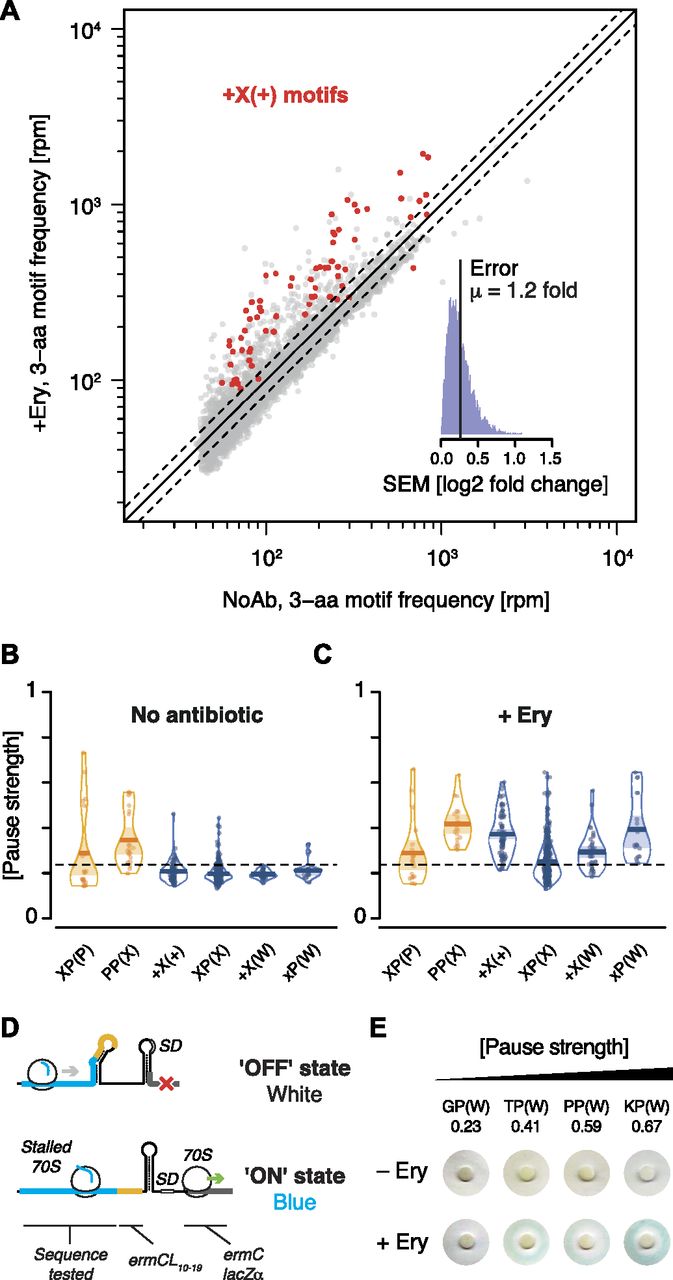
- Figure 3. Nascent peptide-dependent translational arrest in response to Ery.
(A) Frequency of occurrence of 3-aa motifs with low statistical counting error in inverse toeprints obtained in the absence or presence of Ery, with +X(+) motifs indicated in red. The inset represents a histogram of the SEM of the log2 fold change in 3-aa motif frequency upon addition of Ery. The upper and lower dotted lines (gray) indicate 1.20 and 0.83-fold changes, respectively, corresponding to the mean (μ) of the distribution of SEM (log2 fold change). (B, C) RDI (raw data, description and inference) plot showing pause strengths for individual motifs translated in the (B) absence or (C) presence of Ery. Polyproline motifs are shown in yellow and all other motifs are in blue. The horizontal dashed line corresponds to the 0.25 pause strength cutoff used to identify motifs that are enriched upon addition of Ery. (D) Overview of the lacZα-complementation assay used to test the in vivo activity of ErmBL variants (modified from Bailey et al [2008]). (E) Disc-diffusion test plates used to assay the ability of nascent formyl-MAXP(W) to cause translational arrest in vivo. Discs marked with +Ery contain this antibiotic and blue rings result from the induction of a lacZα reporter in response to ribosome stalling at an upstream test ORF (modified from Bailey et al [2008]).
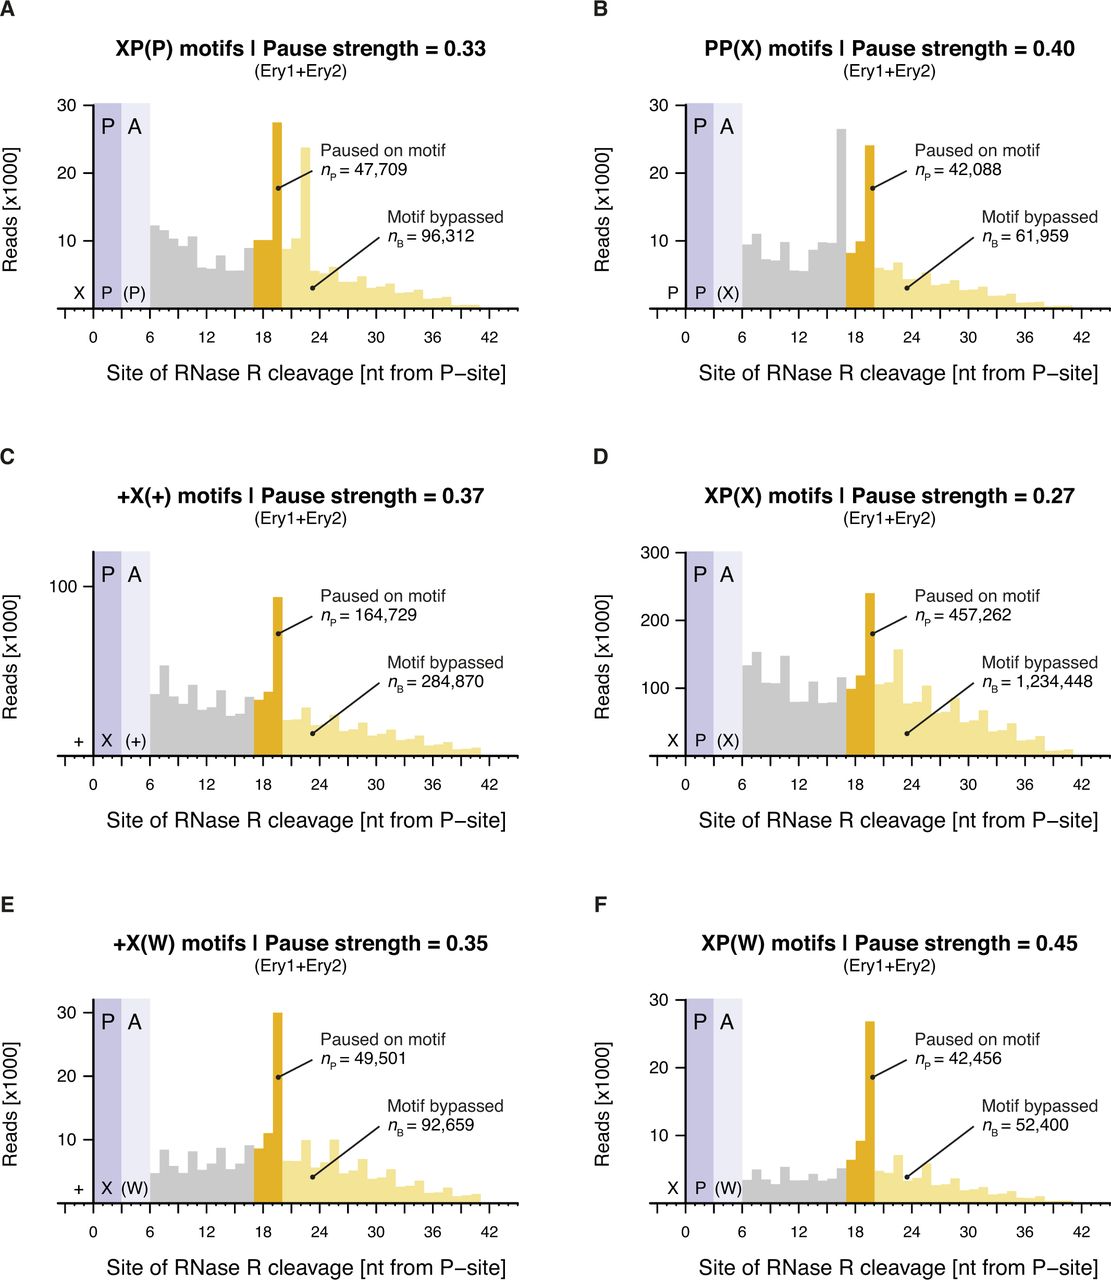
- Figure S9. Calculation of pause strengths for various Ery-dependent arrest motifs.
Histograms of the distances between (A) XP(P), (B) PP(X), (C) +X(+), (D) XP(X), (E) +X(W), and (F) XP(W) motifs and the 3′ end of inverse toeprints obtained in the presence of Ery. Both Ery replicates (Ery1 and Ery2) were combined for this analysis. Calculated pause strengths are shown for each motif.
- Figure S10. Enrichment of 3-aa motifs upon addition of Ery.
(A and B) Plots of pause strength against log2 (fold change) for all possible 3-aa motifs, translated in the (A) absence or (B) presence of Ery. Yellow points correspond to 3-aa motifs that induce translational pausing in the absence of antibiotics. Blue points correspond to motifs with pause strengths ≥0.25 in the presence of Ery and ≥1.5-fold greater than in the absence of a drug, which show a log2 (fold change) in frequency of ≥0.5. All other motifs are shown as gray dots.
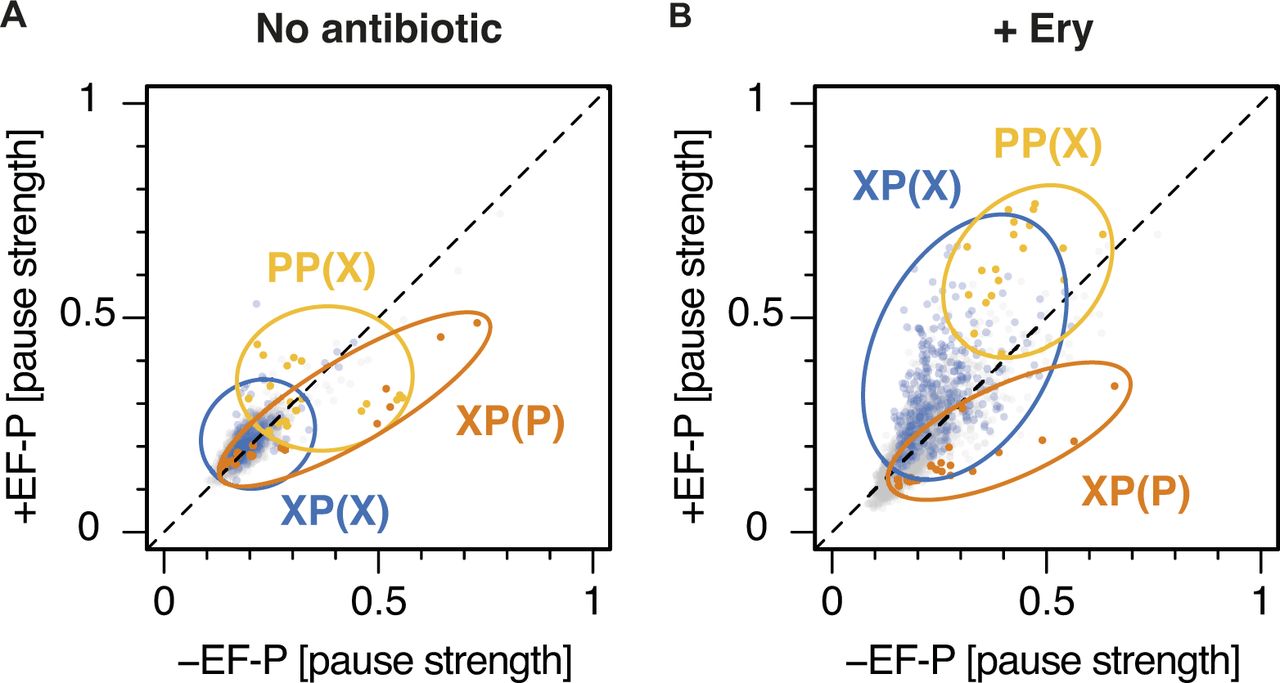
- Figure S11. Ery-dependent pauses at XP(X) motifs are intensified by EF-P.
(A, B) Plots of pause strength in the presence of EF-P against pause strength in the absence of EF-P, for samples (A) without antibiotic or (B) with Ery. XP(P) motifs are indicated in orange, PP(X) motifs in yellow, and XP(X) motifs in blue. All other motifs are in gray. Most XP(X) motifs induce significant drug-dependent pauses in the presence of EF-P, but not in its absence. XP(P) and PP(X) motifs also behave differently in the presence of a drug, with pausing at XP(P) motifs being efficiently rescued by EF-P, whereas PP(X) motifs induce greater pausing in the presence of EF-P.
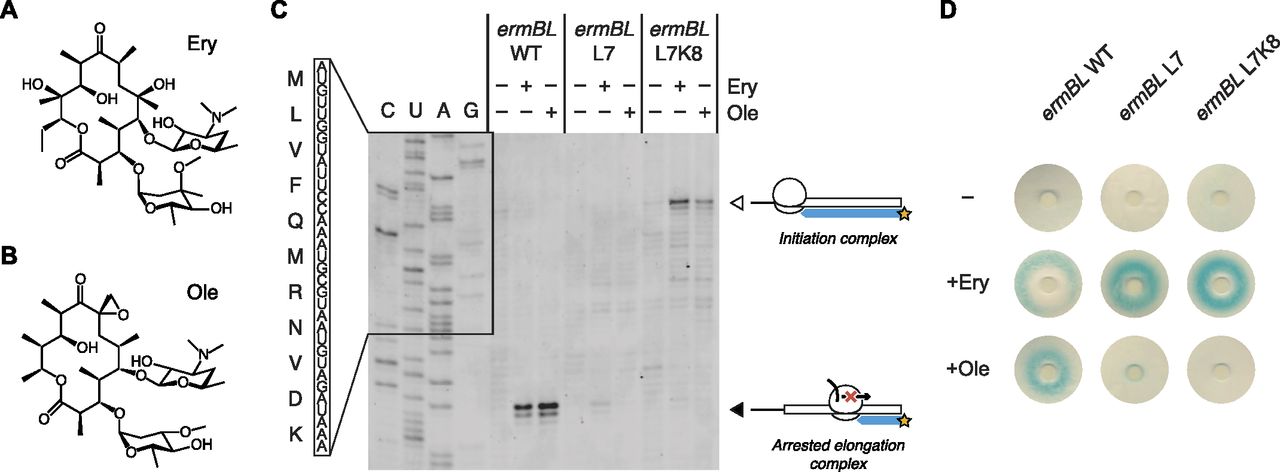
- Figure 4. The ErmBL L7 and L7K8 mutants discriminate between closely related antibiotics.
(A, B) Chemical diagrams for Ery and Ole. (C) Classical toeprinting analysis of translational arrest by wild-type ErmBL (ermBL WT), an L7 single mutant (ermBL L7), and an L7K8 double mutant (ermBL L7K8), in the absence or presence of the antibiotics Ery and Ole. The white arrow indicates ribosomes on the start codon, and the black arrow indicates arrested elongation complexes with the GAU codon encoding Asp-10 in the ribosomal P-site. The sequence of wild-type ErmBL is shown. (D) Disc-diffusion test plates used to assay the ability of nascent ErmBL WT, ErmBL L7, and ErmBL L7K8 to cause translational arrest in vivo in the absence or presence of Ery or Ole soaked into paper discs. It should be noted that the double mutant shows greater antibiotic selectivity in vivo compared with the single mutant, as indicated by the light blue ring observed in the +Ole condition for the ErmBL L7 mutant.
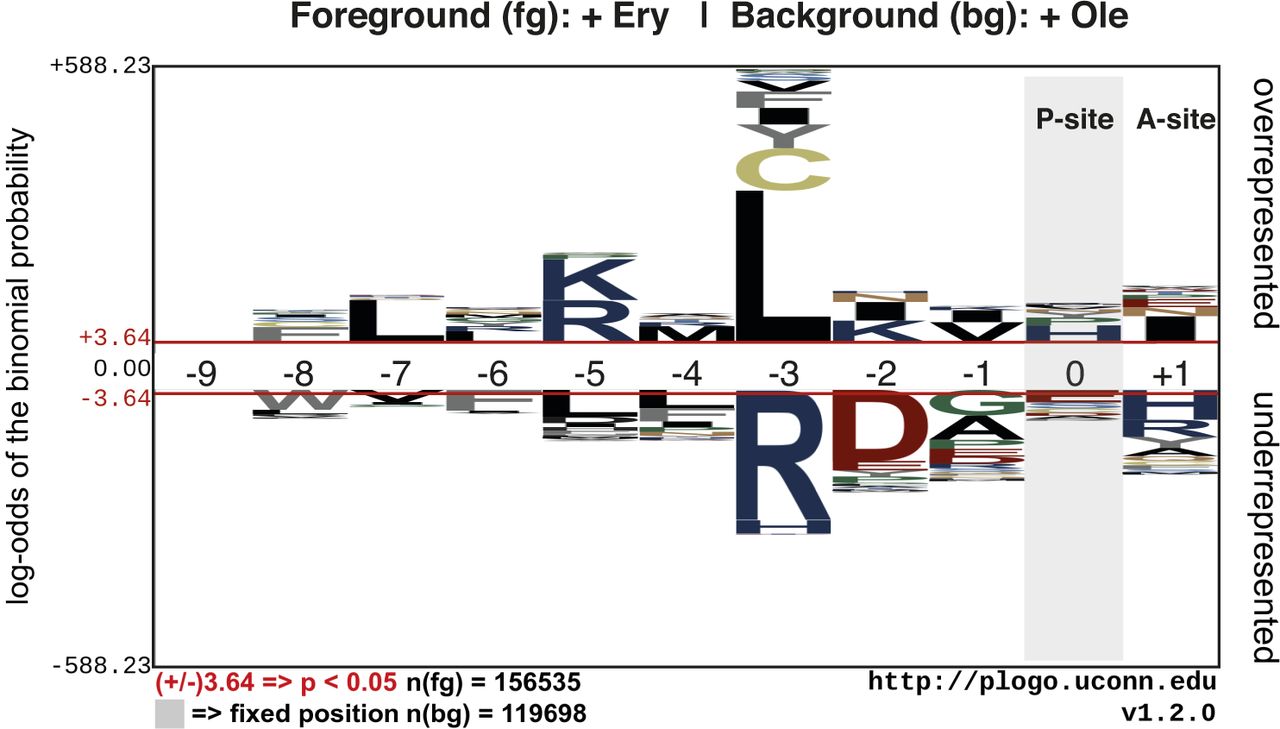
- Figure S12. Overrepresentation or underrepresentation of amino acids at different positions in ErmBL.
Unique ErmBL variants were identified from inverse toeprints obtained after translation in the presence of Ery or Ole. A comparison between these two sets of inverse toeprints was performed using the pLogo server (O'Shea et al, 2013). Peptide numbering is such that residue 0 is in the P-site and +1 is in the A-site.


Supplementary Materials
Table S7 Summary of NGS read processing.


