


Article Figures & Data
Figures
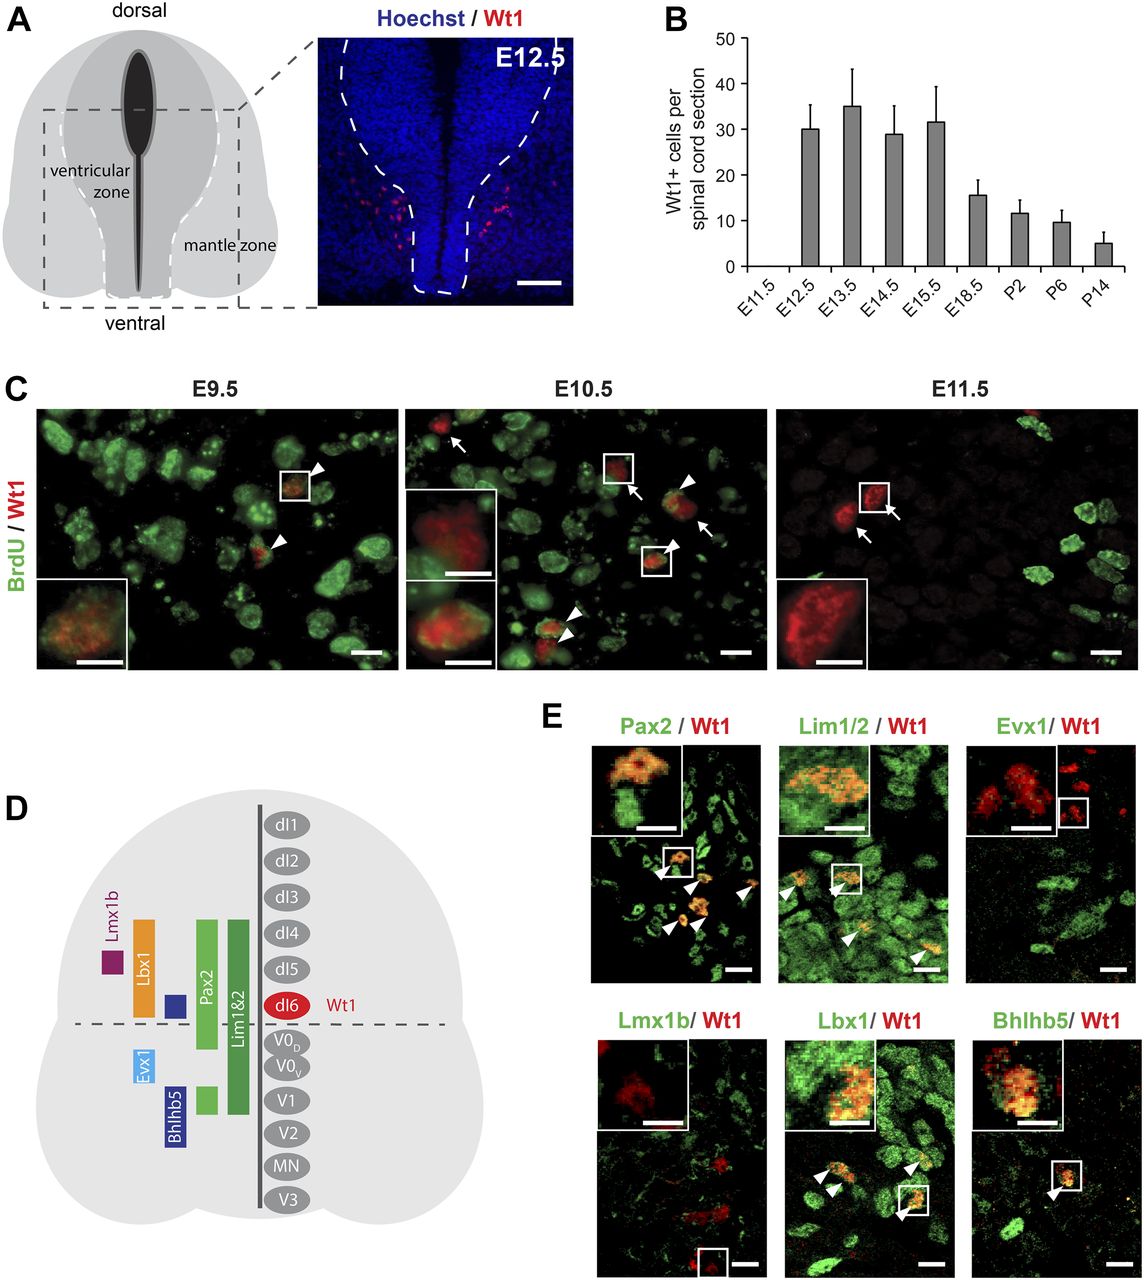
- Figure 1. Characterization of Wt1+ neurons in the developing spinal cord.
(A) Schematic illustration and Wt1 immunolabelling analysis of a transverse section (12 μm) from E12.5 spinal cord showing the position of Wt1+ neurons (red) in the mantle zone of the developing spinal cord. Stippled line represents the border between the ventricular and mantle zones. Scale bar: 50 μm. (B) Plot showing the average cell number of Wt1+ neurons per 12 μm spinal cord section from different embryonic and postnatal stages. Wt1+ neurons are first found at E12.5 and decrease in cell number postnatally. Data expressed as mean ± SD. n = 12–20 embryos. (C) Determination of the birthdate of Wt1+ neurons by BrdU proliferation assay. Proliferating cells situated in the ventricular zone were labelled by BrdU incorporation at different embryonic stages (E9.5, E10.5, and E11.5). Additional immunolabelling of these cells for Wt1 and BrdU at E12.5 revealed that prospective Wt1-expressing cells still proliferate at E9.5 and at E10.5 but not at E11.5. Scale bar: 10 μm. Insets show higher magnifications of respective areas. Scale bar: 5 μm. (D) Schematic illustration of an E12.5 spinal cord section with markers and their occurrence in different neuron populations. These markers were used to establish the origin of Wt1+ neurons as dI6 neurons (red). (E) Immunolabelling of Wt1+ neurons with markers present in dI6 and adjacent interneuron populations. The partly overlapping location of Wt1 with Pax2, Lim1/2, Lbx1, and Bhlhb5 supports a dI6 character. Scale bar: 10 μm. Insets show higher magnifications of respective areas. Scale bar: 5 μm.
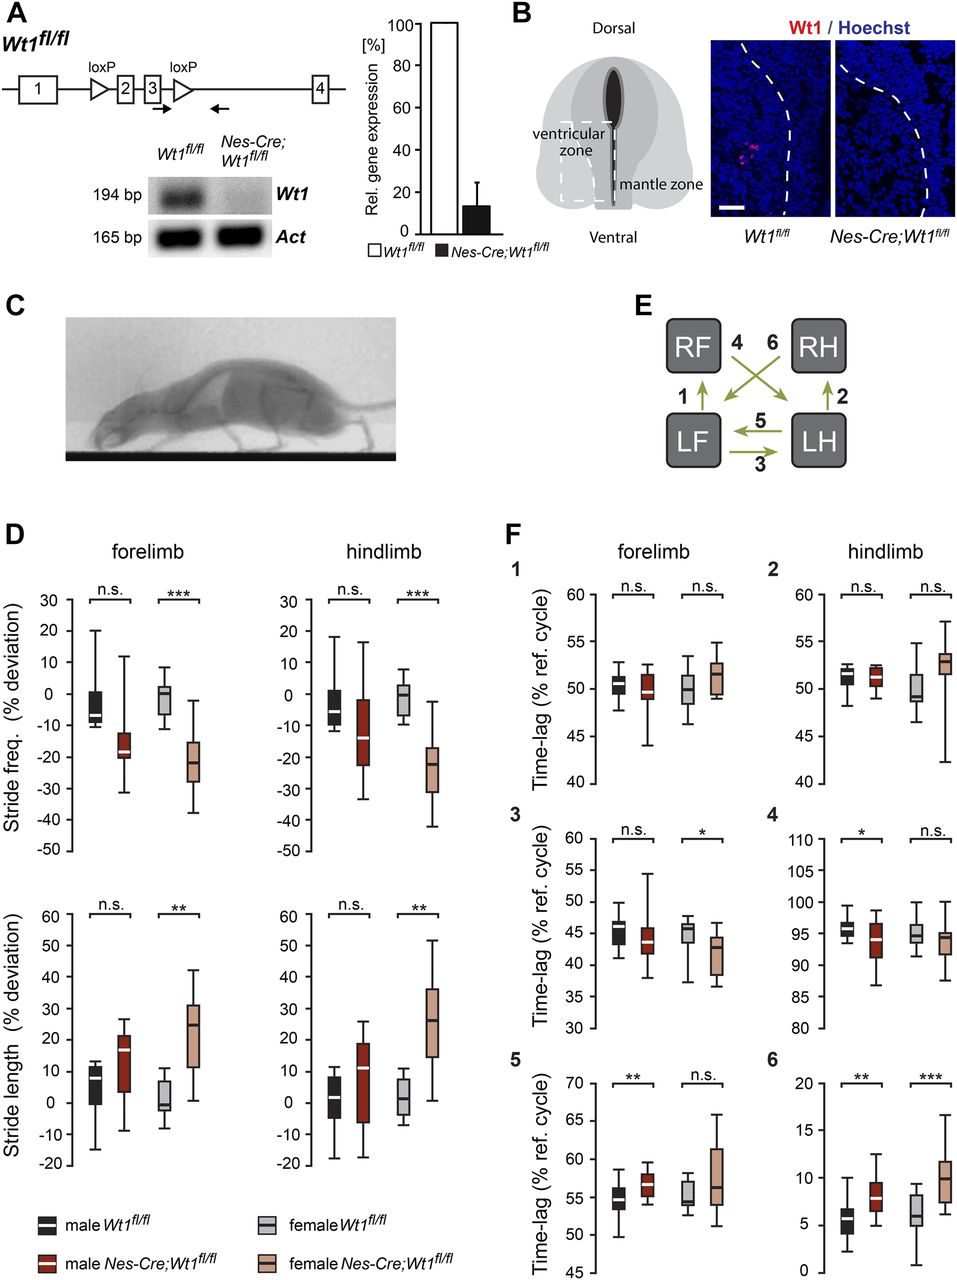
- Figure 2. Mice with Wt1 inactivation display altered locomotion.
(A) Schematic illustration of the Wt1fl/fl allele. loxP sites flanking exons 2 and 3 of the Wt1 coding sequence allow Cre-mediated excision and conditional knockout of Wt1. Confirmation of a functional conditional Wt1 knockout in Nes-Cre;Wt1fl/fl at E12.5 using qRT–PCR (quantification to the right). Data expressed as mean ± SEM. n = 4–5 embryos. Significance determined by using pairwise reallocation randomisation test. (B) Loss of Wt1 immunopositive signals in Nes-Cre;Wt1fl/fl embryos at E12.5 corroborates the loss of Wt1 protein. Schematic illustration shows the position where the pictures were taken. Stippled line represents the border between the ventricular and mantle zones. Scale bar: 40 μm. (C) X-ray radiograph of a walking mouse in lateral perspective. (D) Graphs displaying stride parameters collected in the X-ray radiograph. Stride frequency is significantly lower in female Nes-Cre;Wt1fl/fl mice in both forelimbs and hindlimbs. The stride length in female Nes-Cre;Wt1fl/fl mice is increased compared with female Wt1fl/fl mice, whereas smaller differences are found in male mice. Box plots indicate the median of each group, n = 10 animals (bold white or black line), the 25th and the 75th percentile (box), and the data range (whiskers). Mann–Whitney U test was performed. Significance level of U: ***P < 0.001; **P < 0.01; *P < 0.05. (E, F) Interlimb coordination expressed as the time lag between footfall events in percent stride duration. Left limbs are reference limbs. The scheme (E) illustrates which phase relationships are shown by which graph. Phase relationships (F) between forelimbs (1) and between hindlimbs (2) illustrate overall symmetry of the walk. Timing of forelimb touchdown relative to hindlimb touchdown for ipsilateral (3) and contralateral (4) limbs show only minor differences between Wt1fl/fl and Nes-Cre;Wt1fl/fl mice. The timing of hindlimb footfalls relative to forelimb footfalls (5, 6) differ between Wt1fl/fl and Nes-Cre;Wt1fl/fl mice, particularly at the contralateral limbs. Box plots indicate the median of each group, n = 10 animals (bold white or black line), the 25th and the 75th percentile (box), and the data range (whiskers). Mann–Whitney U test or t test. Significance level of U or ts: ***P < 0.001, **P < 0.01, *P < 0.05.
- Figure S1. Kinematografic analyses.
(A) Stride frequency and stride length of Nes-Cre;Wt1fl/fl, Nes-Cre;Wt1fl/+, and Wt1fl/fl mice. Different parameters were measured using digital footprints of mice running on a transparent treadmill at distinct speed. Control Wt1fl/fl and Nes-Cre;Wt1fl/+ mice do not show significant changes in stride frequency and length in contrast to Nes-Cre;Wt1fl/fl that exhibit a decline in stride frequency (P ≤ 0.001 for fore- and hind limbs at 15 cm/s and P ≤ 0.05 for fore- and hind limbs at 35 cm/s) and an increase in stride length (P ≤ 0.001 for fore- and hind limbs at 15 cm/s and P ≤ 0.05 for fore- and hind limbs at 35 cm/s). n = 20 Wt1fl/fl control; n = 12 Nes-Cre;Wt1fl/fl. (B) Experimental setup of high-resolution X-ray fluoroscopy showing treadmill and C-arm fluoroscope. (C) Absolute and nondimensional speed that animals run on the treadmill. A significant decline in absolute speed between Nes-Cre;Wt1fl/fl mice and control animals (Wt1fl/fl) in males and females was detected. For each of the sexes, n = 10 Wt1fl/fl control; n = 10 Nes-Cre;Wt1fl/fl. Significance level: ***P < 0.001, **P < 0.01, *P < 0.05 (according to one-way ANOVA). (D) Duty factors of forelimbs and hind limbs. The duty factor describes the contact duration of one foot being on the ground relative to the whole gait cycle and thus illustrates the temporal coordination between the stride phases. Duty factors for fore- and hind limbs are increased in Nes-Cre;Wt1fl/fl mice pointing to a prolongation of the stance phase. Box plots indicate the median (bold white or black line), the 25th and the 75th percentile (box), and the data range (whiskers). For each of the sexes, n = 10 Wt1fl/fl control; n = 10 Nes-Cre;Wt1fl/fl. Significance level: ***P < 0.001, **P < 0.01, *P < 0.05 (according to one-way ANOVA). (E) Footfall sequences of a female Wt1fl/fl control and a female Nes-Cre;Wt1fl/fl mouse are shown across three consecutive strides of the left hind limb. Lines represent the stance phases and gaps the swing phases of all four limbs (R, right; L, left; F, forelimb; H, hind limb). (F) Schematic representation of a footfall pattern illustrating footfall sequences across two consecutive strides of the left forelimb that was used as the reference limb. Lines represent the stance phases and gaps the swing phases of all four limbs. One stride cycle starts with the stance phase and ends with the swing phase. The first stride cycle of a left limb (labelled in red)—here the left forelimb—was used as the reference cycle. The interlimb coordination was determined as the phase relationship between a respective limb (here RH, RF, or LH) to the reference limb (LF). It is expressed as the time lag (in percent) of the start of a stride cycle of one limb compared with the start of the reference cycle. For symmetric left–right alternation of limbs (RF to LF), the phase relationship is shifted about half of the reference cycle. The time lag is 50%. For ipsilateral coordination (LH to LF) in wild-type mice, the time lag is about 55% of the reference cycle. For wild-type contralateral coordination (RH to LF) in wild-type mice, the time lag is about 5% of the reference cycle. RH, right hind limb; RF, right forelimb; LF, left forelimb; LH, left hind limb.
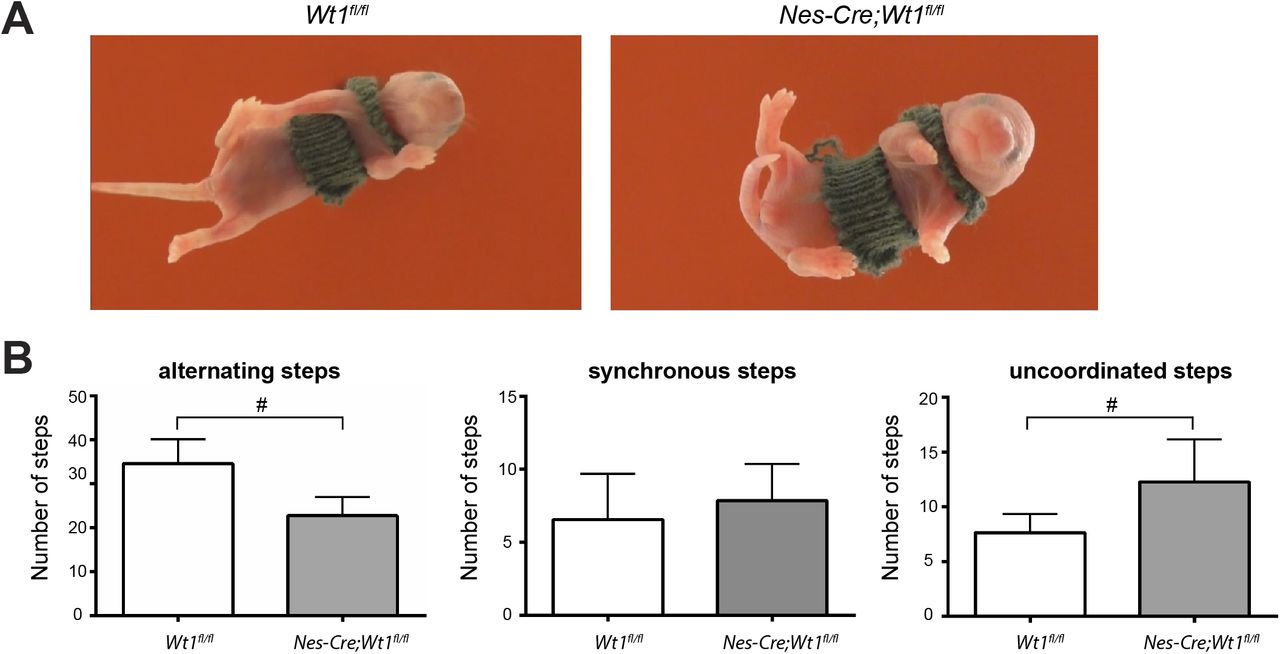
- Figure S2. Phenotypic analysis of control and Wt1-mutant pups.
(A) Images of Nes-Cre;Wt1fl/fl and Wt1fl/fl pups air-stepping. (B) Quantification of the air-stepping experiment. Nes-Cre;Wt1fl/fl mice show a decreased number of alternating and increased number of uncoordinated hind limb steps during air-stepping compared with controls (n = 9 Wt1fl/fl control; n = 7 Nes-Cre;Wt1fl/fl). Data expressed as mean ± SD. Significance level: #P < 0.06.
- Figure 3. Locomotor activity is variable and uncoordinated in Nes-Cre; Wt1fl/fl pups.
(A) Representative traces showing locomotor-like activity during fictive locomotion from left and right lumbar (L) 2 and right L5 ventral roots from control (Nes-Cre;Wt1+/+) and Wt1 conditional knockout (Nes-Cre;Wt1fl/fl) mice. Rhythmic activity was induced by application of NMDA, serotonin, and dopamine. Raw traces in black; rectified, low-pass filtered signal of lL2 trace in blue; activity burst shown in green. Spinal cord schematic depicts the attached suction electrodes to the right (r) and left (l) L2 and rL5 ventral roots. Scale bar: 5 s. (B) Phase analysis and associated coherence power spectra of left/right (L2/L2) and flexor/extensor (L2/L5) recordings. Regions of persistent coherence emerge for control mice at 0.30 Hz, whereas spinal cords from Nes-Cre;Wt1fl/fl mice show an intermittent coherence region at 0.18 Hz. Color-graded scale indicates normalized coherence. Scale bar: 125 s. (C) Locomotor patterns, analyzed from 20 consecutive bursts, reveal impaired and variable left/right and flexor/extensor alternation in Nes-Cre;Wt1fl/fl mice (black dots). Normal left/right and flexor/extensor alternation is maintained in control (white dots) mice. Each dot represents one cord; arrows represent the mean phase. The length of the vector is a measure of the statistical significance of the preferred phase; dashed grey line indicates regions of significance and high significance at 0.5 and 0.8, respectively (Rayleigh test and Watson's U2 test). n = 5 pups (control); n = 7 pups (Nes-Cre;Wt1fl/fl). (D) Nes-Cre;Wt1fl/fl mice have a slower locomotor frequency than control mice. Data are shown as mean ± SD. n = 5 pups (control); n = 7 pups (Nes-Cre;Wt1fl/fl). Significance was tested using two-tailed Mann–Whitney U test. (E, F) The slower locomotor frequency in Nes-Cre;Wt1fl/fl mice is mirrored by an increased cycle period, and burst and interburst duration in both L2 (E) and L5 (F) roots. Data are shown as mean ± SD. n = 5 pups (control); n = 7 pups (Nes-Cre;Wt1fl/fl). Significance was tested using two-tailed Mann–Whitney U test. Significance level: **P < 0.01, ***P < 0.001.
- Figure 4. Innervation of Wt1+ neurons and number of commissural neurons in neonatal mice.
(A) Spinal cords of Wt1-GFP embryos (stage E16.5) show a Wt1+ interneuron immunopositive for GFP. Wt1 is localized in the nucleus and GFP throughout the cell. Scale bar: 2 μm. (B) Wt1+ neurons (green) receive excitatory, inhibitory, and monoaminergic synaptic contacts. Synaptic terminals are identified with synaptophysin (blue). Glutamatergic terminals were immunolabelled for VGLUT2, inhibitory synapses immunolabelled for VGAT, and monoaminergic terminals immunolabelled for VMAT2. Arrows point to individual synaptic terminals (magenta) present on Wt1+ neurons (green). Boxed areas show higher magnification panels of separated channels. Scale bar: 2 μm. (C) GFP-immunolabelled dI6 neurons in the spinal cord of E16.5 Wt1-GFP embryos. GFP antibody staining (green; left panel) and merging with Hoechst (blue; right panel) is shown. Boxed areas represent location of higher magnification panels shown on the right of each panel. Contralateral projections crossing the midline (dashed line) of the spinal cord are visible (arrow heads in magnified images). Scale bar: 20 μm for overview images and 50 μm for magnified images. (D) Photomicrographs of transverse, 60 μm, lumbar, spinal cord sections with applied fluorescein dextran amine (FDA, green) and rhodamine dextran amine (RDA, red) tracers. Higher magnification images (insets) of wild-type (Nes-Cre;Wt1+/+) and homozygous (Nes-Cre;Wt1fl/fl) segments, showing intersegmental retrograde FDA (white arrow), RDA (open arrow), and double-labelled (triangle arrow) neurons. Scale bar: 200 μm. (E) Schematic illustration of FDA (lumbar [L]1) and RDA (L4/5) application sites tracing descending (green), ascending (red), and bifurcating (yellow) neurons. The area of analysis (L2/L3) is indicated by black dashed line. (F–H) Quantification of descending FDA-labelled neurons (F), ascending RDA-labelled neurons (G), and bifurcating, double-labelled neurons per section (H). Descending, ascending, and bifurcating CINs are significantly fewer in homozygous spinal cords compared with control cords (according to Kruskal–Wallis test and followed by a Dunn’s post hoc test comparing all groups). Data expressed as mean ± SEM (Wt1fl/fl control: 3,975 total cells, 215 sections, and nine spinal cords; Nes-Cre;Wt1fl/fl: 3,421 total cells, 228 sections, and seven spinal cords). Significance level: *P < 0.05, **P < 0.01, ***P < 0.001.
- Figure S3. Commissural Wt1+ neurons.
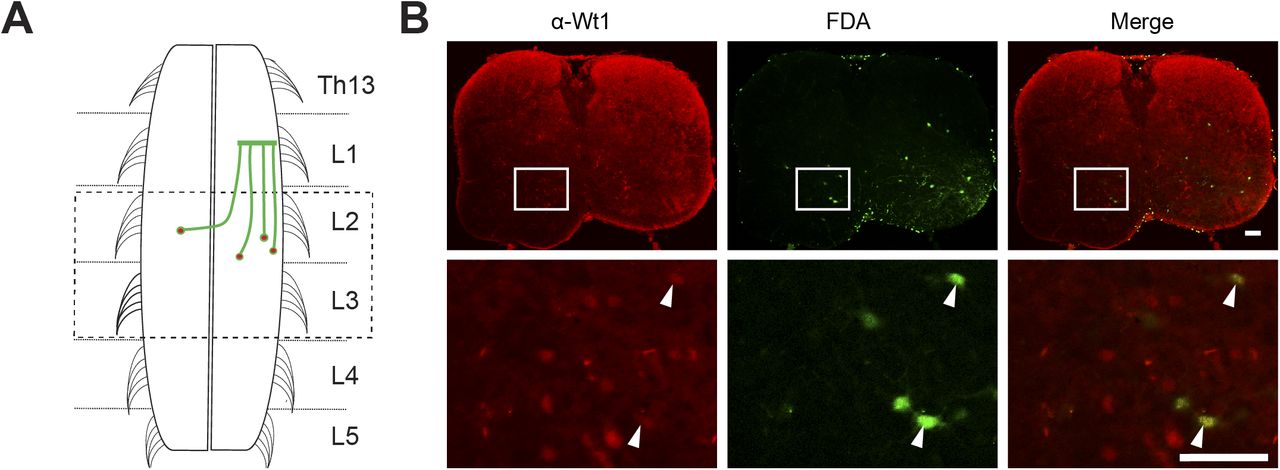
(A) Schematic illustration of fluorescein dextran amine (FDA) application sites to trace commissural Wt1+ neurons. FDA was applied at lumbar segment L1. The spinal cord was sectioned and Wt1+ neurons were labelled using an antibody against Wt1. The area of analysis (L2/L3) is indicated by a dashed box. (B) Axonal projection tracing of commissural Wt1-positive interneurons. Transverse, lumbar spinal cord sections of P3 newborn mice were labelled using an antibody against Wt1 (red) after an FDA tracer; (green) had been inserted into the contralateral hemisphere and retrogradely transported. This retrograde tracing of commissural interneurons reveals that a fraction of Wt1-positive dI6 interneurons projects commissurally. Higher magnification images at the bottom row show Wt1-positive dI6 neurons (white arrow) that overlap with the FDA tracer. Scale bar: 100 μm.
- Figure 5. Alterations in the composition of ventral neurons upon Wt1 knockout.
(A) Average cell number of Wt1, Dmrt3, and Wt1/Dmrt3 neurons per 12 μm spinal cord section from different embryonic and postnatal stages of control (Wt1fl/fl) and Wt1 conditional knockout (Nes-Cre;Wt1fl/fl) mice. Number of Dmrt3 neurons significantly decrease in Nes-Cre;Wt1fl/fl. No Wt1/Dmrt3 neurons are detected in Nes-Cre;Wt1fl/fl animals. Data expressed as mean ± SD. n = 3 embryos per developmental stage and genotype. Significance determined by t test. (B) Average cell number of Lmx1b, Evx1, Foxp2, Chx10, Gata3, and ventral Islet1/2 neurons per 12 μm spinal cord section from control (Wt1fl/fl) and homozygous (Nes-Cre;Wt1fl/fl) mice at E12.5 and E16.5. Number of Evx1+ V0 neurons is significantly increased. Data expressed as mean ± SD. n = 3–4 embryos per developmental stage and genotype. Significance determined by t test. (C) Average cell number of Wt1, Dmrt3, and Wt1/Dmrt3 dI6 neurons and Evx1 V0 neurons per 12 μm spinal cord section from E16.5 control (Wt1fl/fl) and Wt1 conditional knockout (Lbx1-Cre;Wt1fl/fl) mice. Lbx1-Cre–based conditional Wt1 knockouts show a decrease in the amount of dI6 neurons and an increase in the cell number of Evx1 neurons as for Nes-Cre;Wt1fl/fl animals. Data expressed as mean ± SD. n = 3–5 embryos per genotype. Significance determined by t test. (D) Schematic illustration of Wt1-GFP-DTA allele. Cassette consisting of loxP sites flanking GFP coding sequence upstream of DTA was inserted into the Wt1 locus. This cassette allows Cre-mediated ablation of Wt1+ neurons. Graph shows average cell number of Wt1, Dmrt3, and Wt1/Dmrt3 dI6 neurons and Evx1+ V0 neurons per 12 μm spinal cord section from E16.5 wild-type control and Lbx1-Cre;Wt1-GFP-DTA mice. Nearly all Wt1+ neurons are absent. The number of Dmrt3 neurons is significantly decreased. Population size of Evx1 neurons is not altered after ablation of Wt1+ neurons. Data expressed as mean ± SD. n = 3 embryos per genotype. Significance determined by t test. Significance level: *P < 0.05, **P < 0.01, ***P < 0.001.
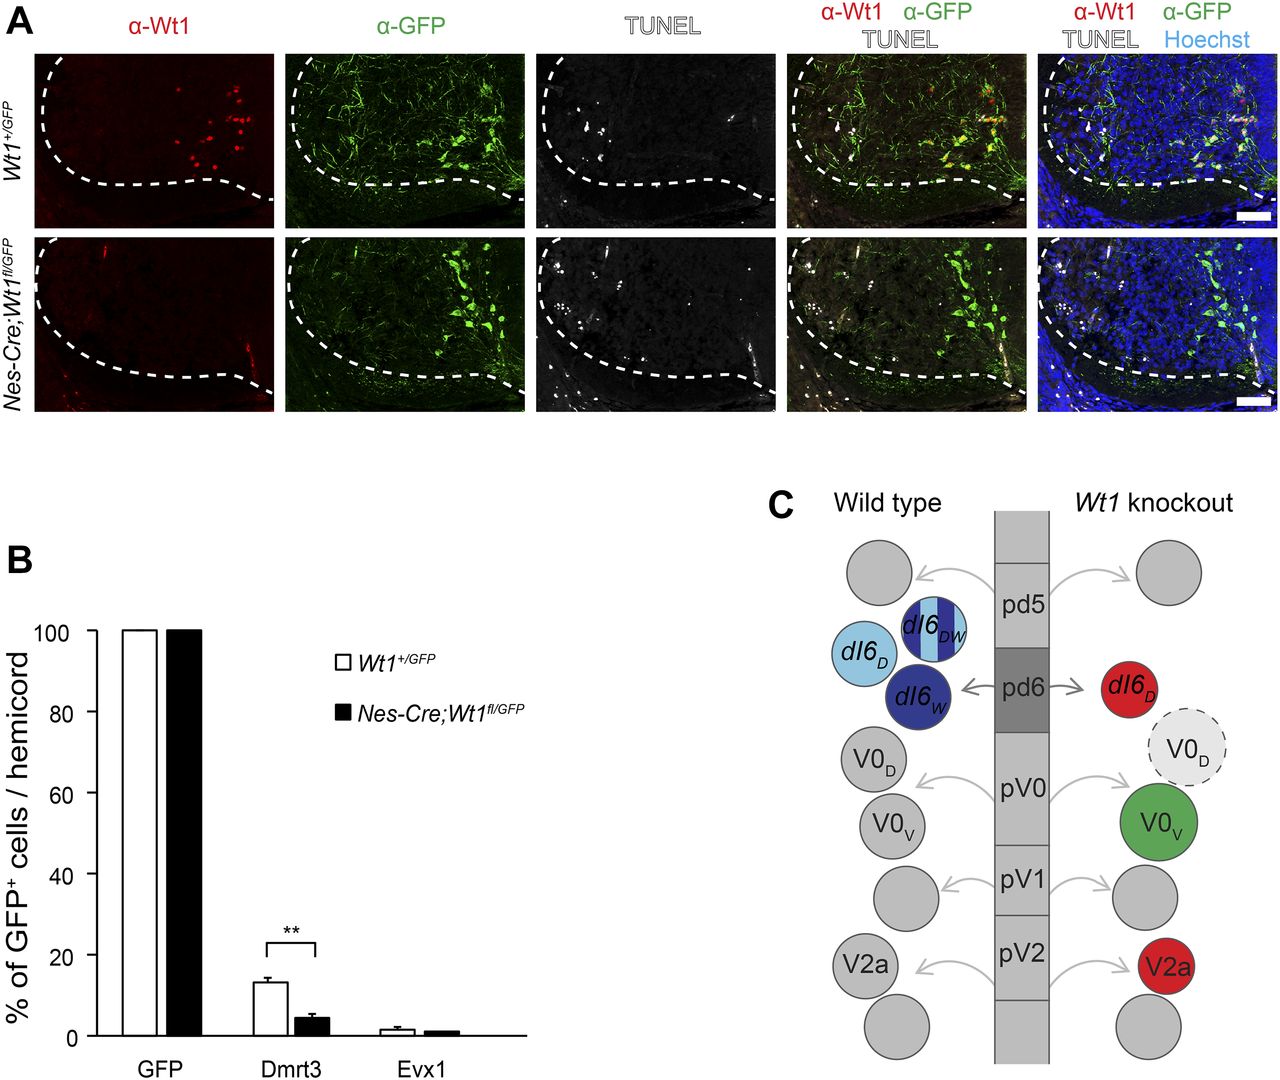
- Figure 6. Indirect trans-differentiation of Wt1+ dI6 neurons.
(A) Immunofluorescence staining of spinal cord sections from E13.5 Wt1+/GFP (control) and Nes-cre;Wt1fl/GFP embryos. GFP is depicted in green, Wt1 in red, TUNEL+ cells in white, and Hoechst in blue. Orientation: dorsal at the top and ventral at the bottom. Scale bar: 50 μm. (B) Quantification of GFP+ cells harbouring the interneuron markers Dmrt3 and Evx1. Analysis was performed using E12.5 Wt1+/GFP (control; n = 3) and Nes-cre;Wt1fl/GFP (n = 3) embryos. The number of cells showing co-localization of GFP and the respective markers was determined and normalized to the total number of GFP+ cells, which was set to 100%. Upon Wt1 knockout, the amount of GFP+ cells possessing Dmrt3 is significantly decreased. The amount of GFP+ cells possessing Evx1 is not altered, suggesting an indirect fate change of dI6 neurons into Evx1+ V0V-like neurons upon Wt1 knockout. Data expressed as mean ± SD. Significance determined by t test. Significance level: **P < 0.01. (C) Scheme represents various progenitor cell domains (pd5, pd6, pV0, pV1, and pV2) that give rise to different populations of spinal cord neurons (shown as circles) in wild-type and tissue-specific Wt1 knockout. In wild-type animals, progenitor cells leave these domains, become postmitotic, and differentiate into distinct interneuron populations that further subdivide. The dI6 interneuron population consists of neurons either positive for Dmrt3 (dI6D), Wt1 (dI6W), or both (dI6DW). Because of the knockout of Wt1, no dI6W and dI6DW are detectable and the number of dI6D neurons is decreased. In contrast, the number of Evx1+ V0V neurons increases, which is an indirect effect as potential dI6W cells that lack Wt1 did not show a Evx1 signal. This effect might be explained by a hypothetical fate change of dI6 neurons into V0D-like neurons (dashed light grey circle). The increased number of V0D neurons would thus prompt the pV0 progenitor cells to differentiate preferentially into V0V neurons, which would compensate the excess amount of V0D neurons and lead to an increase in the population size of Evx1+ V0V neurons. As a secondary effect, the number of V2a neurons, which innervate the V0V neurons, declines at later developmental stages when neurons start to connect to each other, potentially compensating the increased number of V0V neurons. Only the subsets of interneuron populations are shown that are affected by the tissue-specific Wt1 knockout. Red indicates decrease in population size and green indicates increase in population size.


Supplementary Materials
- Video 1
X-ray fluoroscopy video shows skeleton of Wt1fl/fl control mouse running on a treadmill. Download video
- Video 2
X-ray fluoroscopy video shows skeleton of Nes-Cre;Wt1fl/fl mouse running on a treadmill. Download video
- Video 3
Video shows newborn Wt1fl/fl pup performing air-stepping after tail pinch. Download video
- Video 4
Video shows newborn Nes-Cre;Wt1fl/fl pup performing air-stepping after tail pinch. Download video


In this Issue
Subjects
Related Articles
Cited By...
- Characterization of a novel Lbx1 mouse loss of function strain
- Behavioral Characterization of dmrt3a Mutant Zebrafish Reveals Crucial Aspects of Vertebrate Locomotion through Phenotypes Related to Acceleration
- Wt1 positive neurons in the hindbrain are essential for respiration
- Characterization of Dmrt3-Derived Neurons Suggest a Role within Locomotor Circuits